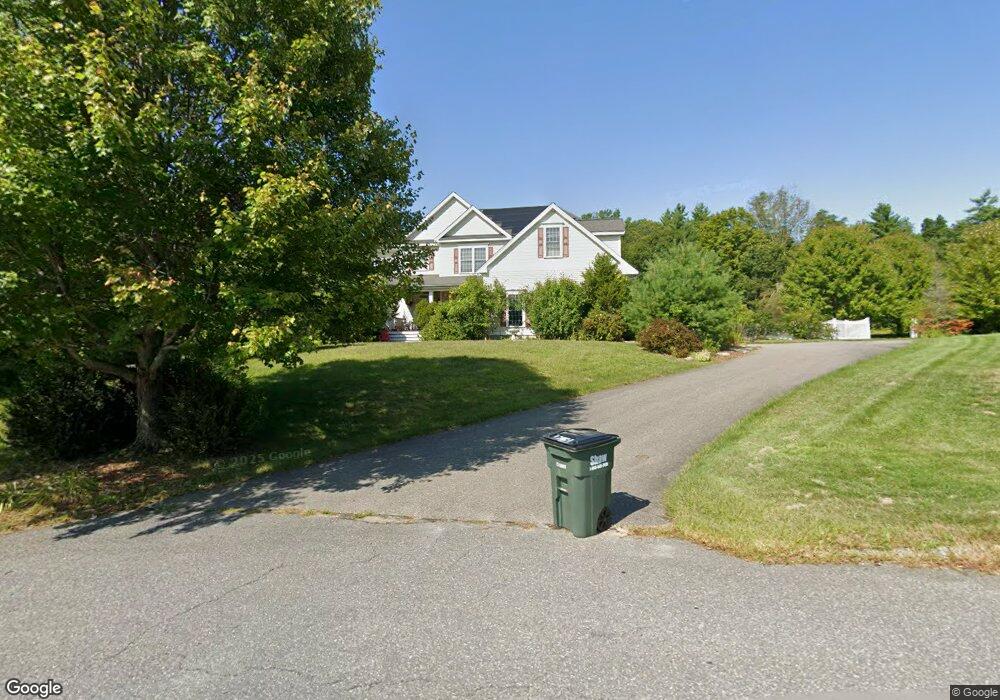
17 Julia Ln Pepperell, MA 01463
Estimated Value: $801,000 - $885,000
4
Beds
3
Baths
3,182
Sq Ft
$266/Sq Ft
Est. Value
About This Home
This home is located at 17 Julia Ln, Pepperell, MA 01463 and is currently estimated at $845,051, approximately $265 per square foot. 17 Julia Ln is a home located in Middlesex County with nearby schools including North Middlesex Regional High School, Pepperell Christian Academy, and Maple Dene & Moppet School.
Ownership History
Date
Name
Owned For
Owner Type
Purchase Details
Closed on
Dec 12, 2011
Sold by
Joyce A Sheridan Ret
Bought by
Morbelli Nicola
Current Estimated Value
Home Financials for this Owner
Home Financials are based on the most recent Mortgage that was taken out on this home.
Original Mortgage
$383,600
Outstanding Balance
$255,383
Interest Rate
3%
Mortgage Type
Purchase Money Mortgage
Estimated Equity
$589,668
Purchase Details
Closed on
Apr 7, 2010
Sold by
Sheridan Joyce A
Bought by
Joyce A Sheridan Ret and Sheridan Joyce A
Purchase Details
Closed on
Sep 23, 2005
Sold by
Roberts M Hicks Inc
Bought by
Sheridan Joyce A
Home Financials for this Owner
Home Financials are based on the most recent Mortgage that was taken out on this home.
Original Mortgage
$249,000
Interest Rate
5.92%
Mortgage Type
Purchase Money Mortgage
Create a Home Valuation Report for This Property
The Home Valuation Report is an in-depth analysis detailing your home's value as well as a comparison with similar homes in the area
Home Values in the Area
Average Home Value in this Area
Purchase History
| Date | Buyer | Sale Price | Title Company |
|---|---|---|---|
| Morbelli Nicola | $479,500 | -- | |
| Joyce A Sheridan Ret | -- | -- | |
| Sheridan Joyce A | $567,956 | -- |
Source: Public Records
Mortgage History
| Date | Status | Borrower | Loan Amount |
|---|---|---|---|
| Open | Morbelli Nicola | $383,600 | |
| Previous Owner | Sheridan Joyce A | $249,000 |
Source: Public Records
Tax History Compared to Growth
Tax History
| Year | Tax Paid | Tax Assessment Tax Assessment Total Assessment is a certain percentage of the fair market value that is determined by local assessors to be the total taxable value of land and additions on the property. | Land | Improvement |
|---|---|---|---|---|
| 2025 | $10,595 | $724,200 | $232,300 | $491,900 |
| 2024 | $9,705 | $676,300 | $212,300 | $464,000 |
| 2023 | $9,977 | $659,000 | $192,300 | $466,700 |
| 2022 | $9,818 | $572,500 | $152,200 | $420,300 |
| 2021 | $9,433 | $526,400 | $128,200 | $398,200 |
| 2020 | $9,049 | $532,900 | $128,200 | $404,700 |
| 2019 | $8,134 | $490,300 | $128,200 | $362,100 |
| 2018 | $7,716 | $470,800 | $128,200 | $342,600 |
| 2017 | $7,309 | $460,000 | $120,200 | $339,800 |
| 2016 | $7,108 | $430,000 | $120,200 | $309,800 |
| 2015 | $6,859 | $430,000 | $120,200 | $309,800 |
| 2014 | $6,799 | $428,700 | $124,200 | $304,500 |
Source: Public Records
Map
Nearby Homes
- 15 Julia Ln
- 15 Julia Ln
- 14 Julia Ln Unit 16
- 14 Julia Ln
- 13 Julia Ln
- 7 Beaver Creek Cir
- 10 Julia Ln
- 11 Julia Ln
- 8 Julia Ln
- 1 Beaver Creek Cir
- 5 Beaver Creek Cir
- 13 Beaver Creek Cir
- 3 Beaver Creek Cir
- 9 Julia Ln
- 8 Beaver Creek Cir
- 6 Julia Ln
- 6 Beaver Creek Cir
- 18 Julia Ln
- 6 Beaver Creek Cir
- 7 Julia Ln