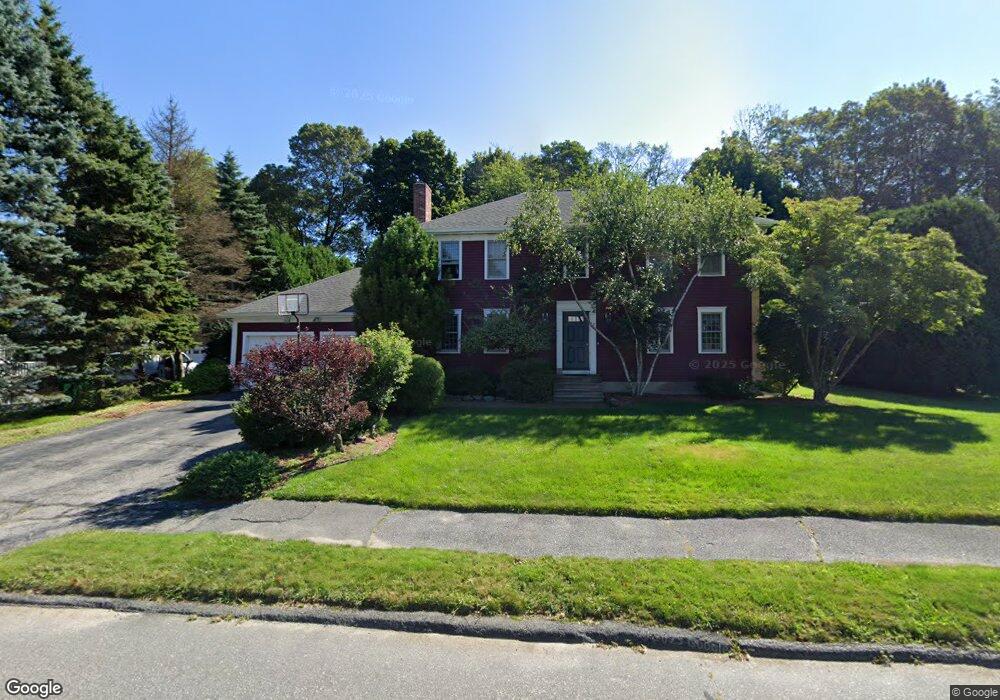
17 Julio Dr Shrewsbury, MA 01545
Estimated Value: $832,000 - $1,395,566
4
Beds
4
Baths
2,240
Sq Ft
$440/Sq Ft
Est. Value
About This Home
This home is located at 17 Julio Dr, Shrewsbury, MA 01545 and is currently estimated at $986,392, approximately $440 per square foot. 17 Julio Dr is a home located in Worcester County with nearby schools including Floral Street School, Sherwood Middle School, and Oak Middle School.
Ownership History
Date
Name
Owned For
Owner Type
Purchase Details
Closed on
Mar 23, 2007
Sold by
Conway Michael J and Conway Virginia B
Bought by
Plr Closing Svcs Llc
Current Estimated Value
Home Financials for this Owner
Home Financials are based on the most recent Mortgage that was taken out on this home.
Original Mortgage
$211,000
Interest Rate
6.33%
Mortgage Type
Purchase Money Mortgage
Purchase Details
Closed on
Oct 11, 1988
Sold by
Parmenter David A
Bought by
Conway Michael J
Create a Home Valuation Report for This Property
The Home Valuation Report is an in-depth analysis detailing your home's value as well as a comparison with similar homes in the area
Home Values in the Area
Average Home Value in this Area
Purchase History
| Date | Buyer | Sale Price | Title Company |
|---|---|---|---|
| Plr Closing Svcs Llc | $419,612 | -- | |
| Stpierre Peter J | $419,612 | -- | |
| Stpierre Peter J | $419,612 | -- | |
| Plr Closing Svcs Llc | $419,612 | -- | |
| Plr Closing Svcs Llc | $419,612 | -- | |
| Conway Michael J | $235,000 | -- |
Source: Public Records
Mortgage History
| Date | Status | Borrower | Loan Amount |
|---|---|---|---|
| Open | Conway Michael J | $207,000 | |
| Closed | Stpierre Peter J | $211,000 |
Source: Public Records
Tax History Compared to Growth
Tax History
| Year | Tax Paid | Tax Assessment Tax Assessment Total Assessment is a certain percentage of the fair market value that is determined by local assessors to be the total taxable value of land and additions on the property. | Land | Improvement |
|---|---|---|---|---|
| 2025 | $91 | $757,200 | $254,700 | $502,500 |
| 2024 | $9,047 | $730,800 | $242,600 | $488,200 |
| 2023 | $8,451 | $644,100 | $242,600 | $401,500 |
| 2022 | $8,187 | $580,200 | $242,600 | $337,600 |
| 2021 | $6,706 | $508,400 | $194,100 | $314,300 |
| 2020 | $6,390 | $512,400 | $194,100 | $318,300 |
| 2019 | $6,057 | $481,900 | $177,300 | $304,600 |
| 2018 | $6,019 | $475,400 | $168,400 | $307,000 |
| 2017 | $5,713 | $445,300 | $152,600 | $292,700 |
| 2016 | $5,746 | $442,000 | $142,600 | $299,400 |
| 2015 | $5,663 | $429,000 | $136,200 | $292,800 |
Source: Public Records
Map
Nearby Homes