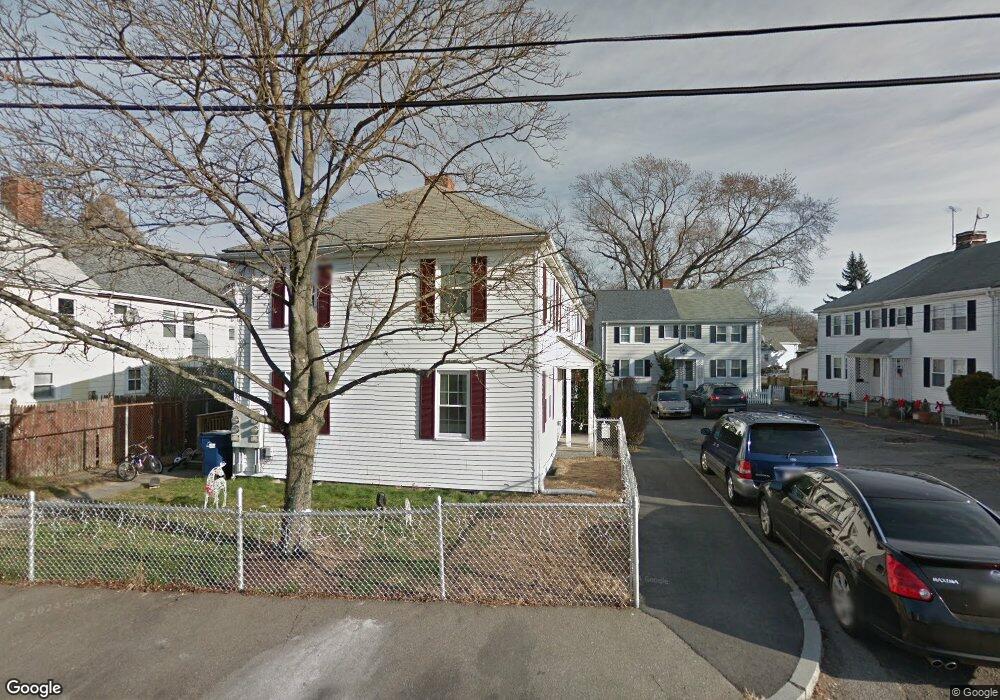
17 Keyes St Quincy, MA 02169
Quincy Point NeighborhoodEstimated Value: $414,000 - $433,000
2
Beds
1
Bath
868
Sq Ft
$487/Sq Ft
Est. Value
About This Home
This home is located at 17 Keyes St, Quincy, MA 02169 and is currently estimated at $422,476, approximately $486 per square foot. 17 Keyes St is a home located in Norfolk County with nearby schools including Point Webster Middle School, Clifford H. Marshall Elementary School, and Quincy High School.
Ownership History
Date
Name
Owned For
Owner Type
Purchase Details
Closed on
Jul 8, 1994
Sold by
Lofstedt Martha E
Bought by
Poulos Paula
Current Estimated Value
Home Financials for this Owner
Home Financials are based on the most recent Mortgage that was taken out on this home.
Original Mortgage
$54,750
Interest Rate
8.51%
Mortgage Type
Purchase Money Mortgage
Create a Home Valuation Report for This Property
The Home Valuation Report is an in-depth analysis detailing your home's value as well as a comparison with similar homes in the area
Home Values in the Area
Average Home Value in this Area
Purchase History
| Date | Buyer | Sale Price | Title Company |
|---|---|---|---|
| Poulos Paula | $73,000 | -- |
Source: Public Records
Mortgage History
| Date | Status | Borrower | Loan Amount |
|---|---|---|---|
| Closed | Poulos Paula | $15,000 | |
| Closed | Poulos Paula | $54,750 | |
| Closed | Poulos Paula | $14,600 |
Source: Public Records
Tax History
| Year | Tax Paid | Tax Assessment Tax Assessment Total Assessment is a certain percentage of the fair market value that is determined by local assessors to be the total taxable value of land and additions on the property. | Land | Improvement |
|---|---|---|---|---|
| 2025 | $4,336 | $376,100 | $219,600 | $156,500 |
| 2024 | $4,145 | $367,800 | $209,100 | $158,700 |
| 2023 | $3,874 | $348,100 | $190,100 | $158,000 |
| 2022 | $3,838 | $320,400 | $172,800 | $147,600 |
| 2021 | $3,686 | $303,600 | $172,800 | $130,800 |
| 2020 | $3,410 | $274,300 | $163,100 | $111,200 |
| 2019 | $3,278 | $261,200 | $151,000 | $110,200 |
| 2018 | $3,082 | $231,000 | $137,200 | $93,800 |
| 2017 | $3,082 | $217,500 | $130,700 | $86,800 |
| 2016 | $2,951 | $205,500 | $118,800 | $86,700 |
| 2015 | $2,793 | $191,300 | $112,100 | $79,200 |
| 2014 | $2,748 | $184,900 | $112,100 | $72,800 |
Source: Public Records
Map
Nearby Homes
- 51 Sumner St
- 101 Sumner St Unit B
- 72 Main St
- 161 Sumner St Unit 2
- 16 Perley Place
- 7-9 Kittredge Ave
- 388 Washington St Unit 301
- 388 Washington St Unit 205
- 388 Washington St Unit 405
- 388 Washington St Unit 202
- 388 Washington St Unit 203
- 388 Washington St Unit 401
- 388 Washington St Unit 302
- 388 Washington St Unit 204
- 388 Washington St Unit 101
- 388 Washington St Unit 304
- 5 Main St
- 200 Falls Blvd Unit B305
- 200 Falls Blvd Unit I301
- 500 Washington St Unit 201
Your Personal Tour Guide
Ask me questions while you tour the home.