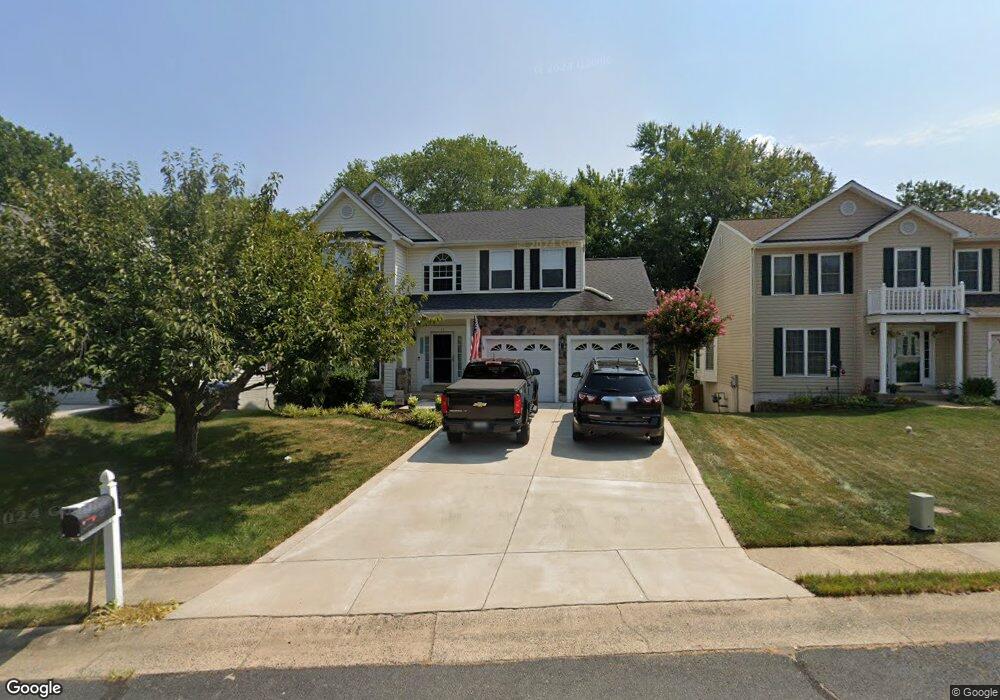
17 Kimberly Dr Stafford, VA 22554
North Stafford Courthouse NeighborhoodEstimated Value: $551,000 - $569,750
5
Beds
4
Baths
2,102
Sq Ft
$265/Sq Ft
Est. Value
About This Home
This home is located at 17 Kimberly Dr, Stafford, VA 22554 and is currently estimated at $557,688, approximately $265 per square foot. 17 Kimberly Dr is a home located in Stafford County with nearby schools including Park Ridge Elementary School, Rodney E. Thompson Middle School, and North Stafford High School.
Ownership History
Date
Name
Owned For
Owner Type
Purchase Details
Closed on
May 31, 2007
Sold by
Foley Briann
Bought by
Jackson Anthony
Current Estimated Value
Home Financials for this Owner
Home Financials are based on the most recent Mortgage that was taken out on this home.
Original Mortgage
$336,800
Outstanding Balance
$206,644
Interest Rate
6.24%
Mortgage Type
New Conventional
Estimated Equity
$351,044
Purchase Details
Closed on
Mar 29, 2000
Sold by
Taylor Andrew H
Bought by
Foley Brian A
Purchase Details
Closed on
Dec 19, 1997
Sold by
Hour Homes Of Park Ridge
Bought by
Taylor Andrew H
Home Financials for this Owner
Home Financials are based on the most recent Mortgage that was taken out on this home.
Original Mortgage
$178,800
Interest Rate
7.14%
Mortgage Type
VA
Create a Home Valuation Report for This Property
The Home Valuation Report is an in-depth analysis detailing your home's value as well as a comparison with similar homes in the area
Home Values in the Area
Average Home Value in this Area
Purchase History
| Date | Buyer | Sale Price | Title Company |
|---|---|---|---|
| Jackson Anthony | $421,000 | -- | |
| Foley Brian A | $184,000 | -- | |
| Taylor Andrew H | $178,800 | -- |
Source: Public Records
Mortgage History
| Date | Status | Borrower | Loan Amount |
|---|---|---|---|
| Open | Jackson Anthony | $336,800 | |
| Previous Owner | Taylor Andrew H | $178,800 |
Source: Public Records
Tax History Compared to Growth
Tax History
| Year | Tax Paid | Tax Assessment Tax Assessment Total Assessment is a certain percentage of the fair market value that is determined by local assessors to be the total taxable value of land and additions on the property. | Land | Improvement |
|---|---|---|---|---|
| 2025 | $4,105 | $452,700 | $135,000 | $317,700 |
| 2024 | $4,105 | $452,700 | $135,000 | $317,700 |
| 2023 | $3,765 | $398,400 | $110,000 | $288,400 |
| 2022 | $3,386 | $398,400 | $110,000 | $288,400 |
| 2021 | $3,134 | $323,100 | $85,000 | $238,100 |
| 2020 | $3,134 | $323,100 | $85,000 | $238,100 |
| 2019 | $3,154 | $312,300 | $85,000 | $227,300 |
| 2018 | $3,092 | $312,300 | $85,000 | $227,300 |
| 2017 | $2,923 | $295,300 | $75,000 | $220,300 |
| 2016 | $2,923 | $295,300 | $75,000 | $220,300 |
| 2015 | -- | $285,700 | $75,000 | $210,700 |
| 2014 | -- | $285,700 | $75,000 | $210,700 |
Source: Public Records
Map
Nearby Homes