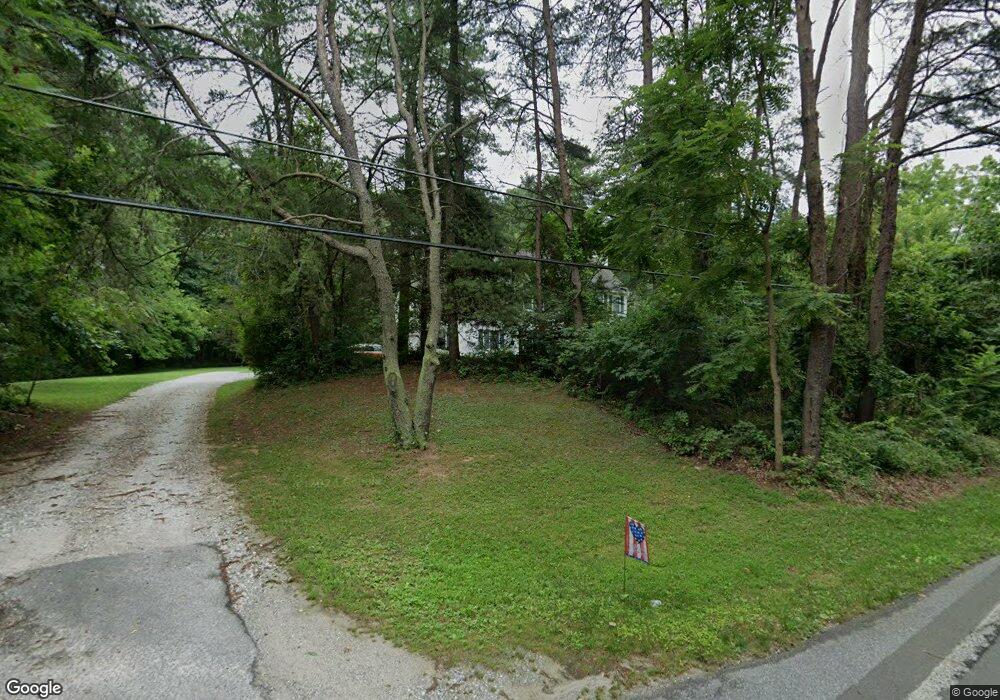
17 Klee Mill Rd Sykesville, MD 21784
Estimated Value: $558,000 - $670,912
--
Bed
3
Baths
2,136
Sq Ft
$295/Sq Ft
Est. Value
About This Home
This home is located at 17 Klee Mill Rd, Sykesville, MD 21784 and is currently estimated at $630,228, approximately $295 per square foot. 17 Klee Mill Rd is a home located in Carroll County with nearby schools including Linton Springs Elementary School, Sykesville Middle School, and Century High School.
Ownership History
Date
Name
Owned For
Owner Type
Purchase Details
Closed on
Jul 12, 2020
Sold by
Eldridge Jonathan E and Eldridge Suanne B
Bought by
Finder Jaime L and Finder Crystal Allison
Current Estimated Value
Home Financials for this Owner
Home Financials are based on the most recent Mortgage that was taken out on this home.
Original Mortgage
$481,045
Outstanding Balance
$426,559
Interest Rate
3.1%
Mortgage Type
VA
Estimated Equity
$203,669
Purchase Details
Closed on
Nov 1, 2016
Sold by
Eldridge Jonathan E and Eldridge Suzanne B
Bought by
Geppert Theodore R and Geppert Joanne S
Home Financials for this Owner
Home Financials are based on the most recent Mortgage that was taken out on this home.
Original Mortgage
$418,056
Interest Rate
3.25%
Mortgage Type
Adjustable Rate Mortgage/ARM
Purchase Details
Closed on
Nov 16, 2000
Sold by
Pletzer Earl
Bought by
Eldridge Jonathan E and Eldridge Suzanne B
Create a Home Valuation Report for This Property
The Home Valuation Report is an in-depth analysis detailing your home's value as well as a comparison with similar homes in the area
Home Values in the Area
Average Home Value in this Area
Purchase History
| Date | Buyer | Sale Price | Title Company |
|---|---|---|---|
| Finder Jaime L | $470,000 | Universal Title | |
| Geppert Theodore R | $225,000 | Sage Title Group Llc | |
| Eldridge Jonathan E | $80,000 | -- |
Source: Public Records
Mortgage History
| Date | Status | Borrower | Loan Amount |
|---|---|---|---|
| Open | Finder Jaime L | $481,045 | |
| Previous Owner | Geppert Theodore R | $418,056 |
Source: Public Records
Tax History Compared to Growth
Tax History
| Year | Tax Paid | Tax Assessment Tax Assessment Total Assessment is a certain percentage of the fair market value that is determined by local assessors to be the total taxable value of land and additions on the property. | Land | Improvement |
|---|---|---|---|---|
| 2025 | $5,440 | $518,400 | $0 | $0 |
| 2024 | $5,440 | $480,400 | $199,400 | $281,000 |
| 2023 | $4,873 | $429,833 | $0 | $0 |
| 2022 | $4,307 | $379,267 | $0 | $0 |
| 2021 | $7,669 | $328,700 | $164,400 | $164,300 |
| 2020 | $3,728 | $327,533 | $0 | $0 |
| 2019 | $3,322 | $326,367 | $0 | $0 |
| 2018 | $3,740 | $325,200 | $164,400 | $160,800 |
| 2017 | $3,702 | $325,200 | $0 | $0 |
| 2016 | -- | $325,200 | $0 | $0 |
| 2015 | -- | $329,500 | $0 | $0 |
| 2014 | -- | $329,500 | $0 | $0 |
Source: Public Records
Map
Nearby Homes
- 601 Sherry Dr
- 42 Liberty Rd Unit D
- 5530 Jim Pickett Rd
- 4114 Old Washington Rd
- 224 Old Liberty Rd
- 610 Okemo Dr
- HS1 Kenard Dr
- 5615 Bartholow Rd
- 0 Bear Branch Rd
- 970 Oak Tree Rd
- 618 Lynn Way
- 707 Old Liberty Rd
- 5725 Hodges Rd
- 4145 London Bridge Rd
- 5712 Hodges Rd
- 0 Klees Mill Rd
- 832 Chanter Dr
- 1110 Algernon Dr
- 1103 Cape Ct
- 608 Angus Dr