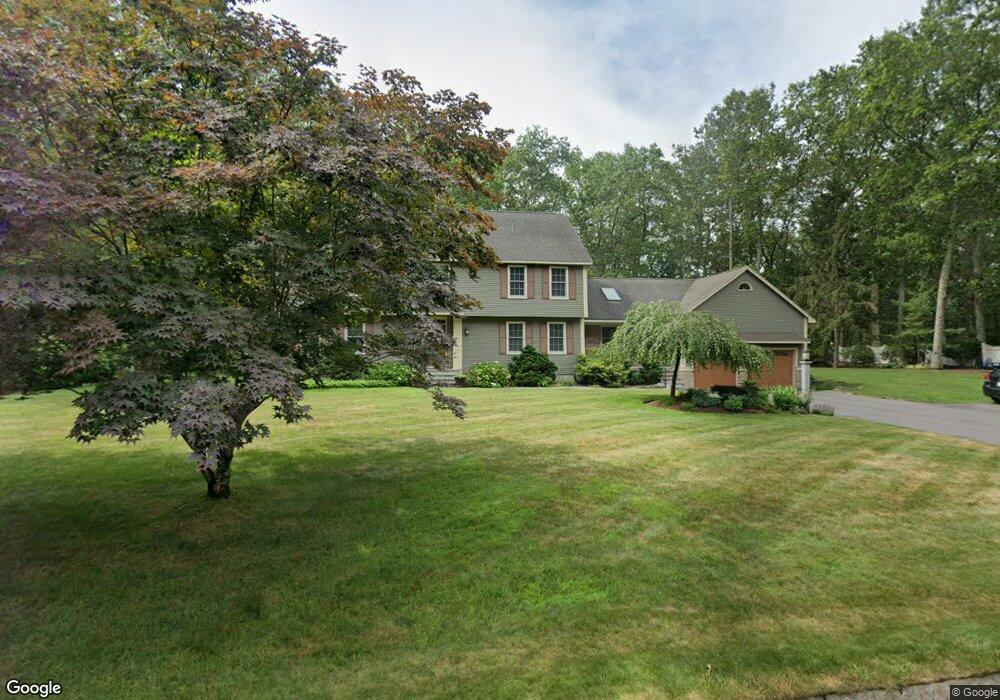
17 Kylemore Dr Westford, MA 01886
Estimated Value: $1,087,000 - $1,508,000
4
Beds
4
Baths
3,158
Sq Ft
$407/Sq Ft
Est. Value
About This Home
This home is located at 17 Kylemore Dr, Westford, MA 01886 and is currently estimated at $1,286,675, approximately $407 per square foot. 17 Kylemore Dr is a home located in Middlesex County with nearby schools including Rita E. Miller Elementary School, Day Elementary School, and Blanchard Middle School.
Ownership History
Date
Name
Owned For
Owner Type
Purchase Details
Closed on
May 16, 2024
Sold by
Ely Paul A and Russo-Ely Theresa K
Bought by
Ely Ft and Ely
Current Estimated Value
Purchase Details
Closed on
Oct 29, 2009
Sold by
Moter Juta
Bought by
Ely Paul A and Ely Theresa E
Home Financials for this Owner
Home Financials are based on the most recent Mortgage that was taken out on this home.
Original Mortgage
$380,000
Interest Rate
5.06%
Mortgage Type
Purchase Money Mortgage
Purchase Details
Closed on
Feb 2, 1987
Sold by
Flaherty Patrick J
Bought by
Moter John J
Home Financials for this Owner
Home Financials are based on the most recent Mortgage that was taken out on this home.
Original Mortgage
$225,000
Interest Rate
9.26%
Mortgage Type
Purchase Money Mortgage
Create a Home Valuation Report for This Property
The Home Valuation Report is an in-depth analysis detailing your home's value as well as a comparison with similar homes in the area
Home Values in the Area
Average Home Value in this Area
Purchase History
| Date | Buyer | Sale Price | Title Company |
|---|---|---|---|
| Ely Ft | -- | None Available | |
| Ely Ft | -- | None Available | |
| Ely Paul A | $635,000 | -- | |
| Ely Paul A | $635,000 | -- | |
| Moter John J | $412,000 | -- |
Source: Public Records
Mortgage History
| Date | Status | Borrower | Loan Amount |
|---|---|---|---|
| Previous Owner | Moter John J | $30,000 | |
| Previous Owner | Ely Paul A | $380,000 | |
| Previous Owner | Moter John J | $150,000 | |
| Previous Owner | Moter John J | $225,000 |
Source: Public Records
Tax History Compared to Growth
Tax History
| Year | Tax Paid | Tax Assessment Tax Assessment Total Assessment is a certain percentage of the fair market value that is determined by local assessors to be the total taxable value of land and additions on the property. | Land | Improvement |
|---|---|---|---|---|
| 2025 | $14,975 | $1,087,500 | $330,500 | $757,000 |
| 2024 | $14,975 | $1,087,500 | $330,500 | $757,000 |
| 2023 | $14,788 | $1,001,900 | $314,600 | $687,300 |
| 2022 | $15,340 | $951,600 | $277,200 | $674,400 |
| 2021 | $6,546 | $826,600 | $277,200 | $549,400 |
| 2020 | $13,551 | $829,800 | $277,200 | $552,600 |
| 2019 | $13,087 | $790,300 | $277,200 | $513,100 |
| 2018 | $12,264 | $758,000 | $267,400 | $490,600 |
| 2017 | $11,605 | $707,200 | $267,400 | $439,800 |
| 2016 | $11,609 | $712,200 | $270,100 | $442,100 |
| 2015 | $11,426 | $703,600 | $260,100 | $443,500 |
| 2014 | $10,488 | $631,800 | $250,300 | $381,500 |
Source: Public Records
Map
Nearby Homes
- 66 N Main St Unit 66
- 64 N Main St Unit 64
- 3 Hillside Ave
- 19-21 Broadway St
- 11 River St
- 66 Patten Rd
- 7 Mill Park Place
- 16 Abbot St
- 34 West St
- 28 Graniteville Rd
- 1 Woodridge Ln
- 8 Sandy Beach Rd
- 5 Colonel Rolls Dr
- 16 Main St Unit 2
- 7 Dempsey Way
- 18 Fletcher Rd
- 10 Lynwood Ln
- 3 Woolsack Dr
- 12 Brookfield Dr Unit A
- 18 B Pilgrim Dr Unit 24