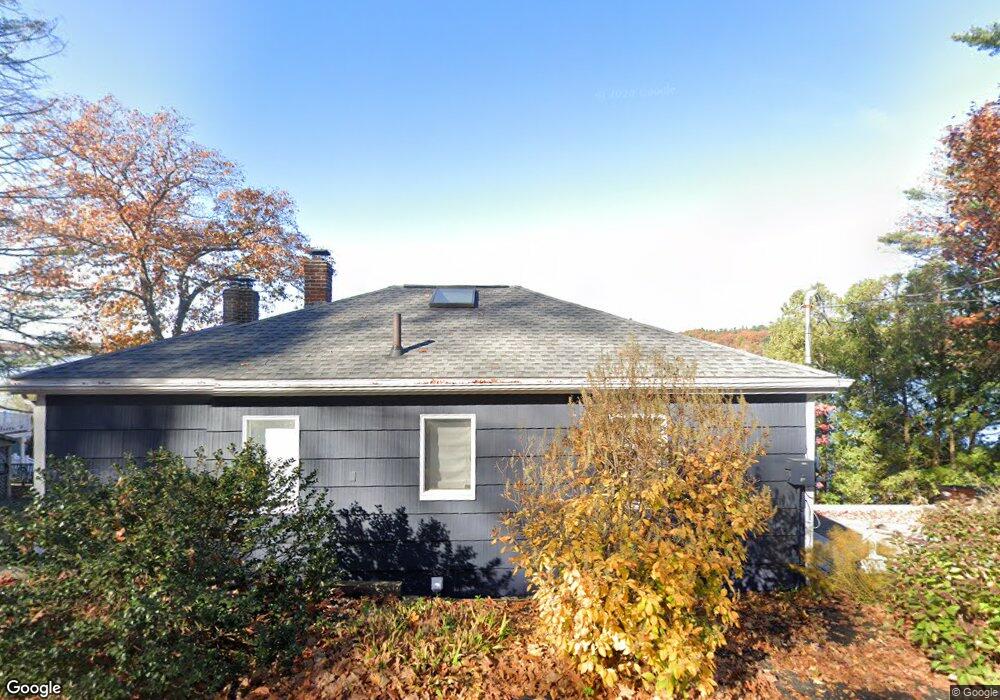
17 Lakeshore Dr Amesbury, MA 01913
Estimated Value: $745,000 - $912,000
4
Beds
2
Baths
736
Sq Ft
$1,084/Sq Ft
Est. Value
About This Home
This home is located at 17 Lakeshore Dr, Amesbury, MA 01913 and is currently estimated at $797,985, approximately $1,084 per square foot. 17 Lakeshore Dr is a home located in Essex County with nearby schools including Amesbury High School.
Ownership History
Date
Name
Owned For
Owner Type
Purchase Details
Closed on
May 31, 2024
Sold by
Roberts Cynthia and Roberts Roger
Bought by
Roberts Ft and Roberts
Current Estimated Value
Purchase Details
Closed on
May 15, 2023
Sold by
Francis Carolyn A Est
Bought by
Linardos Joanne
Home Financials for this Owner
Home Financials are based on the most recent Mortgage that was taken out on this home.
Original Mortgage
$612,000
Interest Rate
6.32%
Mortgage Type
Purchase Money Mortgage
Purchase Details
Closed on
Jul 14, 2016
Sold by
Francis Carolyn A and Pelavin Anne K
Bought by
Francis Carolyn A
Purchase Details
Closed on
Apr 1, 2013
Sold by
Pace Alfred T and Pace Josephine
Bought by
Pace 2Nd Alfred T
Purchase Details
Closed on
Oct 6, 2010
Sold by
Francis Carolyn A
Bought by
Francis Carolyn A and Pelavin Anne
Home Financials for this Owner
Home Financials are based on the most recent Mortgage that was taken out on this home.
Original Mortgage
$275,000
Interest Rate
4.37%
Mortgage Type
Purchase Money Mortgage
Purchase Details
Closed on
Jun 28, 2002
Sold by
Smith Kristen A and Annis Darlene R
Bought by
Francis Carolyn A
Create a Home Valuation Report for This Property
The Home Valuation Report is an in-depth analysis detailing your home's value as well as a comparison with similar homes in the area
Home Values in the Area
Average Home Value in this Area
Purchase History
| Date | Buyer | Sale Price | Title Company |
|---|---|---|---|
| Roberts Ft | -- | None Available | |
| Roberts Ft | -- | None Available | |
| Linardos Joanne | $765,000 | None Available | |
| Francis Carolyn A | -- | -- | |
| Francis Carolyn A | -- | -- | |
| Francis Carolyn A | $428,000 | -- | |
| Pace 2Nd Alfred T | -- | -- |
Source: Public Records
Mortgage History
| Date | Status | Borrower | Loan Amount |
|---|---|---|---|
| Previous Owner | Linardos Joanne | $612,000 | |
| Previous Owner | Francis Carolyn A | $275,000 | |
| Previous Owner | Francis Carolyn A | $308,000 | |
| Previous Owner | Francis Carolyn A | $279,000 |
Source: Public Records
Tax History
| Year | Tax Paid | Tax Assessment Tax Assessment Total Assessment is a certain percentage of the fair market value that is determined by local assessors to be the total taxable value of land and additions on the property. | Land | Improvement |
|---|---|---|---|---|
| 2025 | $10,456 | $683,400 | $429,000 | $254,400 |
| 2024 | $8,544 | $546,300 | $325,000 | $221,300 |
| 2023 | $7,794 | $477,000 | $267,600 | $209,400 |
| 2021 | $7,652 | $419,300 | $223,000 | $196,300 |
| 2020 | $7,193 | $418,700 | $223,000 | $195,700 |
| 2018 | $6,136 | $323,100 | $182,400 | $140,700 |
Source: Public Records
Map
Nearby Homes
Your Personal Tour Guide
Ask me questions while you tour the home.