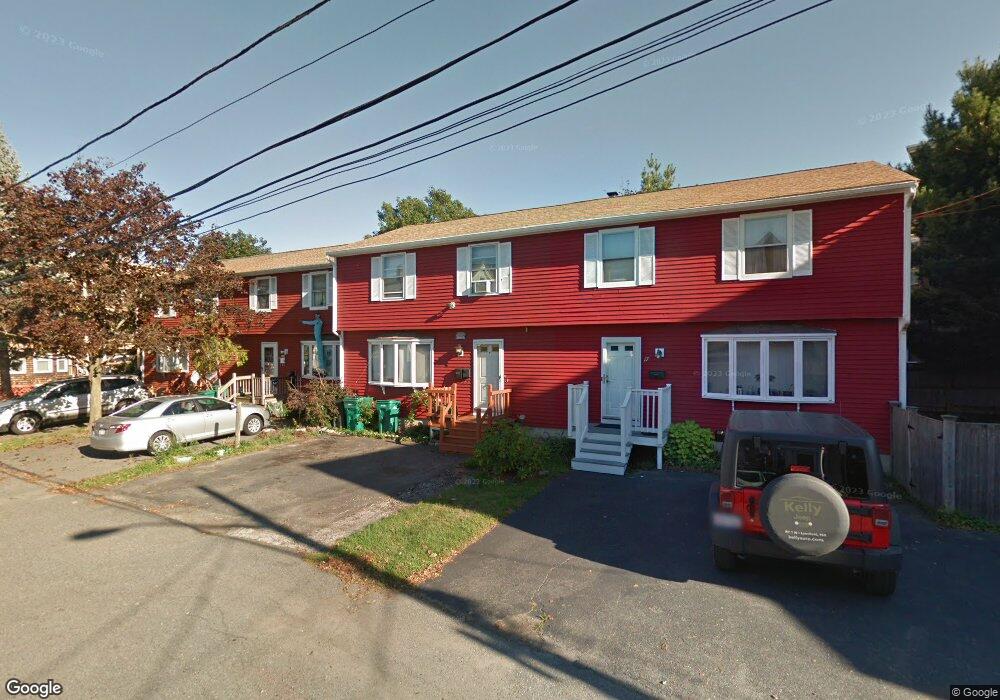
17 Lander Ave Unit 23 Lynn, MA 01902
Fayette Street NeighborhoodEstimated Value: $320,000 - $484,000
3
Beds
2
Baths
1,202
Sq Ft
$337/Sq Ft
Est. Value
About This Home
This home is located at 17 Lander Ave Unit 23, Lynn, MA 01902 and is currently estimated at $405,177, approximately $337 per square foot. 17 Lander Ave Unit 23 is a home located in Essex County with nearby schools including E.J. Harrington School, William R. Fallon School, and Marshall Middle School.
Ownership History
Date
Name
Owned For
Owner Type
Purchase Details
Closed on
Mar 30, 2022
Sold by
Kupcevic Danilo and Kupcevic Silva
Bought by
Kupcevic Milan and Kupcevic Sonja
Current Estimated Value
Home Financials for this Owner
Home Financials are based on the most recent Mortgage that was taken out on this home.
Original Mortgage
$230,968
Outstanding Balance
$215,411
Interest Rate
3.92%
Mortgage Type
Purchase Money Mortgage
Estimated Equity
$189,766
Purchase Details
Closed on
Aug 22, 2001
Sold by
Barrientos Robert M and Gould James F
Bought by
Kupcevic Danilo and Kupcevic Silva
Home Financials for this Owner
Home Financials are based on the most recent Mortgage that was taken out on this home.
Original Mortgage
$122,500
Interest Rate
7.21%
Mortgage Type
Purchase Money Mortgage
Purchase Details
Closed on
Nov 18, 1994
Sold by
Nab Asset Venture 2 Lp
Bought by
Barrientos Robt M and Gould James F
Create a Home Valuation Report for This Property
The Home Valuation Report is an in-depth analysis detailing your home's value as well as a comparison with similar homes in the area
Home Values in the Area
Average Home Value in this Area
Purchase History
| Date | Buyer | Sale Price | Title Company |
|---|---|---|---|
| Kupcevic Milan | $255,000 | None Available | |
| Kupcevic Milan | $255,000 | None Available | |
| Kupcevic Milan | $255,000 | None Available | |
| Kupcevic Danilo | $129,000 | -- | |
| Kupcevic Danilo | $129,000 | -- | |
| Barrientos Robt M | $34,900 | -- | |
| Barrientos Robt M | $34,900 | -- |
Source: Public Records
Mortgage History
| Date | Status | Borrower | Loan Amount |
|---|---|---|---|
| Open | Kupcevic Milan | $230,968 | |
| Closed | Kupcevic Milan | $230,968 | |
| Previous Owner | Barrientos Robt M | $122,500 |
Source: Public Records
Tax History Compared to Growth
Tax History
| Year | Tax Paid | Tax Assessment Tax Assessment Total Assessment is a certain percentage of the fair market value that is determined by local assessors to be the total taxable value of land and additions on the property. | Land | Improvement |
|---|---|---|---|---|
| 2025 | $3,653 | $352,600 | $0 | $352,600 |
| 2024 | $3,576 | $339,600 | $0 | $339,600 |
| 2023 | $3,342 | $299,700 | $0 | $299,700 |
| 2022 | $3,598 | $289,500 | $0 | $289,500 |
| 2021 | $3,844 | $295,000 | $0 | $295,000 |
| 2020 | $3,192 | $238,200 | $0 | $238,200 |
| 2019 | $3,054 | $213,600 | $0 | $213,600 |
| 2018 | $2,645 | $189,900 | $0 | $189,900 |
| 2017 | $2,563 | $164,300 | $0 | $164,300 |
| 2016 | $2,243 | $138,600 | $0 | $138,600 |
| 2015 | $2,226 | $132,900 | $0 | $132,900 |
Source: Public Records
Map
Nearby Homes
- 38 Chestnut St
- 14-16 Dexter St
- 13 Portland St Unit 4
- 24 Parrott St
- 42 Joyce St Unit H
- 13 Nahant St Unit 2D
- 13 Nahant St Unit 4A
- 13 Nahant St Unit 3A
- 13 Nahant St Unit 4C
- 13 Nahant St Unit 3B
- 13 Nahant St Unit 4B
- 38 Cherry St Unit 1
- 2 Mount Vernon St
- 248 Essex St
- 7 Sidney Ave
- 344 Essex St
- 380 Essex St
- 14 Mount Pleasant Place
- 129 Williams Ave
- 42 Basset St
- 17 Lander Ave Unit 23
- 17 Lander Ave Unit 23
- 17 Lander Ave Unit 23
- 17 Lander Ave Unit 1
- 17 Lander Ave Unit 17-23-1
- 17 Lander Ave Unit 17
- 7 Fortesque Terrace Unit 2
- 7 Fortesque Terrace Unit 6
- 7 Fortesque Terrace
- 7 Fortesque Terrace Unit 4
- 7 Fortesque Terrace Unit 1
- 22 Lander Ave
- 13 Lander Ave
- 16 Lander Ave
- 8 Lander Ave
- 9 Lander Ave
- 9 Lander Ave Unit 3
- 44 Chestnut St Unit 3
- 17 Lander St
- 26 Lander St