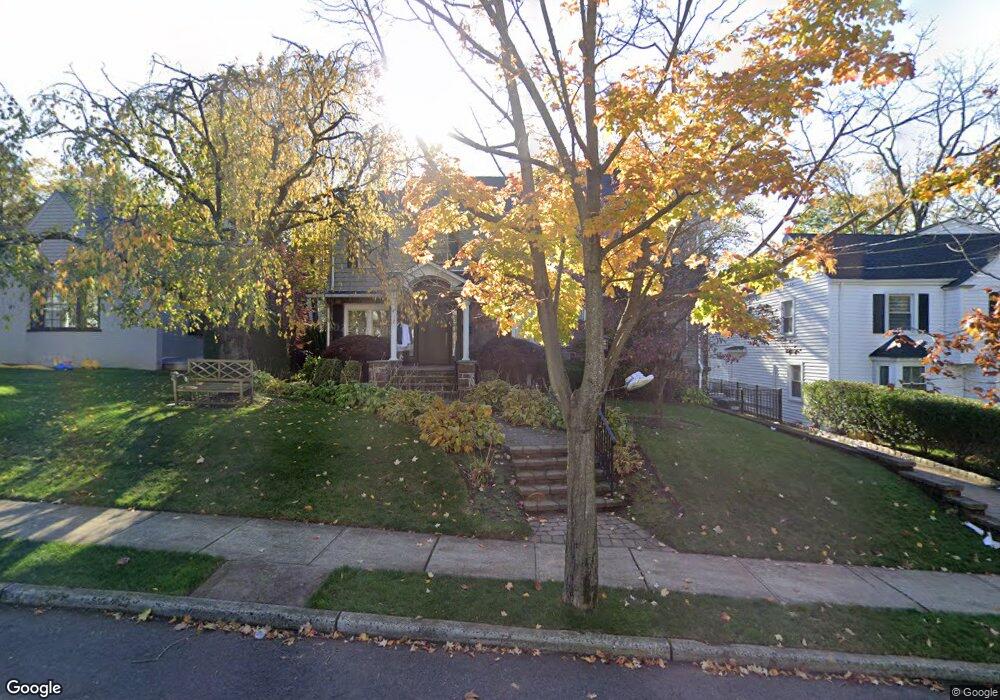
17 Laurel Ave Clifton, NJ 07012
Rosemawr NeighborhoodEstimated Value: $1,008,000 - $1,536,000
--
Bed
--
Bath
3,622
Sq Ft
$338/Sq Ft
Est. Value
About This Home
This home is located at 17 Laurel Ave, Clifton, NJ 07012 and is currently estimated at $1,224,984, approximately $338 per square foot. 17 Laurel Ave is a home located in Passaic County with nearby schools including Clifton High School, Yeshiva Ktana Of Passaic Boys, and Collegiate School.
Ownership History
Date
Name
Owned For
Owner Type
Purchase Details
Closed on
Feb 24, 2010
Sold by
Hess Morton and Hess Betsy
Bought by
Trainer Lennie and Trainer Rachel
Current Estimated Value
Home Financials for this Owner
Home Financials are based on the most recent Mortgage that was taken out on this home.
Original Mortgage
$330,000
Outstanding Balance
$219,154
Interest Rate
5.02%
Mortgage Type
Purchase Money Mortgage
Estimated Equity
$1,005,830
Create a Home Valuation Report for This Property
The Home Valuation Report is an in-depth analysis detailing your home's value as well as a comparison with similar homes in the area
Home Values in the Area
Average Home Value in this Area
Purchase History
| Date | Buyer | Sale Price | Title Company |
|---|---|---|---|
| Trainer Lennie | $535,000 | -- |
Source: Public Records
Mortgage History
| Date | Status | Borrower | Loan Amount |
|---|---|---|---|
| Open | Trainer Lennie | $330,000 |
Source: Public Records
Tax History Compared to Growth
Tax History
| Year | Tax Paid | Tax Assessment Tax Assessment Total Assessment is a certain percentage of the fair market value that is determined by local assessors to be the total taxable value of land and additions on the property. | Land | Improvement |
|---|---|---|---|---|
| 2025 | $20,550 | $346,200 | $110,900 | $235,300 |
| 2024 | $20,059 | $346,200 | $110,900 | $235,300 |
| 2022 | $19,768 | $346,200 | $110,900 | $235,300 |
| 2021 | $18,954 | $346,200 | $110,900 | $235,300 |
| 2020 | $19,017 | $346,200 | $110,900 | $235,300 |
| 2019 | $18,882 | $346,200 | $110,900 | $235,300 |
| 2018 | $18,774 | $346,200 | $110,900 | $235,300 |
| 2017 | $17,830 | $332,400 | $110,900 | $221,500 |
| 2016 | $17,484 | $332,400 | $110,900 | $221,500 |
| 2015 | $17,315 | $332,400 | $110,900 | $221,500 |
| 2014 | $12,633 | $247,600 | $110,900 | $136,700 |
Source: Public Records
Map
Nearby Homes
- 14 Laurel Ave
- 55 Heights Rd
- 189 Mineral Spring Ave
- 375 Brook Ave
- 2 Forest Ct
- 8 Hampton Rd
- 174 Cresthill Ave
- 40 Scoles Ave
- 35 Dawson Ave
- 64 Rowland Ave
- 9 Century Place
- 76 Scoles Ave
- 65 Martin Ave
- 473 Broadway
- 403 South Pkwy
- 390 South Pkwy
- 412 Broadway Unit 25A
- 347 South Pkwy
- 50 Patricia Place
- 138 Scoles Ave