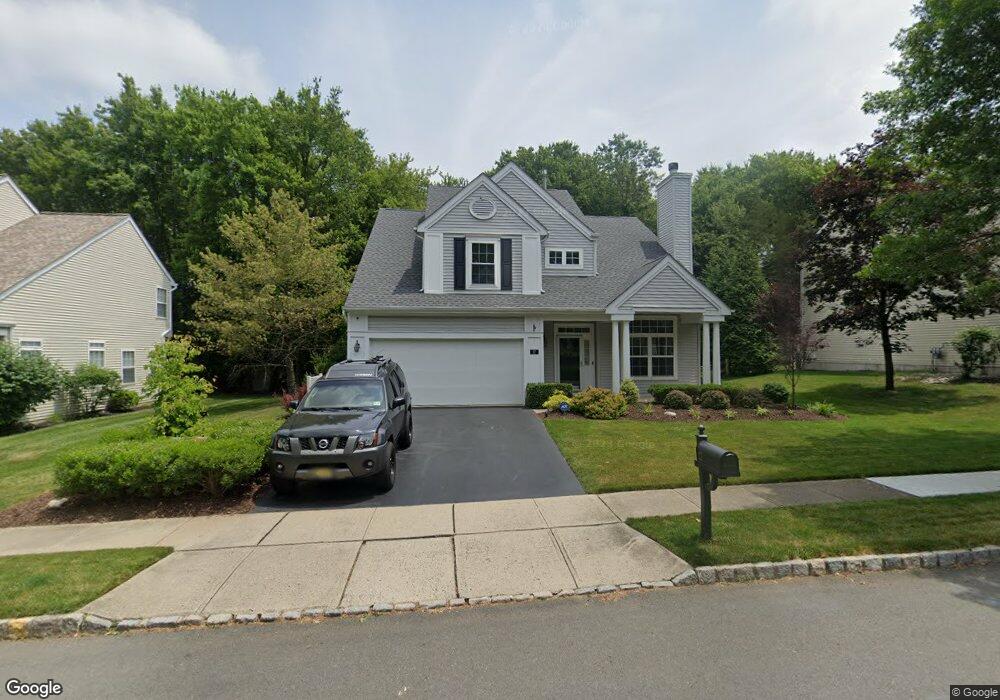
17 Lehigh Ct Princeton, NJ 08540
Estimated Value: $808,574 - $964,000
--
Bed
--
Bath
1,861
Sq Ft
$479/Sq Ft
Est. Value
About This Home
This home is located at 17 Lehigh Ct, Princeton, NJ 08540 and is currently estimated at $891,894, approximately $479 per square foot. 17 Lehigh Ct is a home located in Somerset County with nearby schools including Orchard Hill Elementary School, Montgomery Lower Mid School, and Village Elementary School.
Ownership History
Date
Name
Owned For
Owner Type
Purchase Details
Closed on
Sep 17, 2012
Sold by
Hickey Colleen M
Bought by
Warren Adam and Fiorentino Nicole
Current Estimated Value
Home Financials for this Owner
Home Financials are based on the most recent Mortgage that was taken out on this home.
Original Mortgage
$175,000
Outstanding Balance
$121,207
Interest Rate
3.59%
Mortgage Type
New Conventional
Estimated Equity
$770,687
Purchase Details
Closed on
Jul 14, 2000
Sold by
Skoglund James
Bought by
Hickey Colleen
Home Financials for this Owner
Home Financials are based on the most recent Mortgage that was taken out on this home.
Original Mortgage
$240,000
Interest Rate
8.18%
Purchase Details
Closed on
Jul 12, 1995
Sold by
Segal
Bought by
Peck Sharol
Home Financials for this Owner
Home Financials are based on the most recent Mortgage that was taken out on this home.
Original Mortgage
$171,000
Interest Rate
7.49%
Create a Home Valuation Report for This Property
The Home Valuation Report is an in-depth analysis detailing your home's value as well as a comparison with similar homes in the area
Home Values in the Area
Average Home Value in this Area
Purchase History
| Date | Buyer | Sale Price | Title Company |
|---|---|---|---|
| Warren Adam | -- | Fidelity National Title Ins | |
| Hickey Colleen | $320,000 | -- | |
| Peck Sharol | $220,882 | -- |
Source: Public Records
Mortgage History
| Date | Status | Borrower | Loan Amount |
|---|---|---|---|
| Open | Warren Adam | $175,000 | |
| Previous Owner | Hickey Colleen | $240,000 | |
| Previous Owner | Peck Sharol | $171,000 |
Source: Public Records
Tax History Compared to Growth
Tax History
| Year | Tax Paid | Tax Assessment Tax Assessment Total Assessment is a certain percentage of the fair market value that is determined by local assessors to be the total taxable value of land and additions on the property. | Land | Improvement |
|---|---|---|---|---|
| 2025 | $13,990 | $408,100 | $225,200 | $182,900 |
| 2024 | $13,990 | $408,100 | $225,200 | $182,900 |
| 2023 | $13,969 | $408,100 | $225,200 | $182,900 |
| 2022 | $13,153 | $408,100 | $225,200 | $182,900 |
| 2021 | $13,039 | $408,100 | $225,200 | $182,900 |
| 2020 | $12,929 | $408,100 | $225,200 | $182,900 |
| 2019 | $12,839 | $408,100 | $225,200 | $182,900 |
| 2018 | $12,537 | $408,100 | $225,200 | $182,900 |
| 2017 | $12,345 | $408,100 | $225,200 | $182,900 |
| 2016 | $12,129 | $408,100 | $225,200 | $182,900 |
| 2015 | $11,859 | $408,100 | $225,200 | $182,900 |
| 2014 | $11,717 | $408,100 | $225,200 | $182,900 |
Source: Public Records
Map
Nearby Homes
- 18 Rutgers Ln
- 7 Harvard Cir
- 58 Maidenhead Rd
- 182 Jonathon Dayton Ct
- 6 York Dr
- 851 Mount Lucas Rd
- 108 Dogwood Hill
- 36 Ross Stevenson Cir
- 501 State Rd
- 617 Mount Lucas Rd
- 516 Mount Lucas Rd
- 95 Cherry Brook Dr
- 857 Cherry Hill Rd
- 16 Cherry Brook Dr
- 0 Cherry Hill Rd Unit NJSO2004962
- 33 Kennedy Ct
- 17 E Hartwick Dr
- 2 E Hartwick Dr
- 339 Mount Lucas Rd
- 458 Cherry Hill Rd