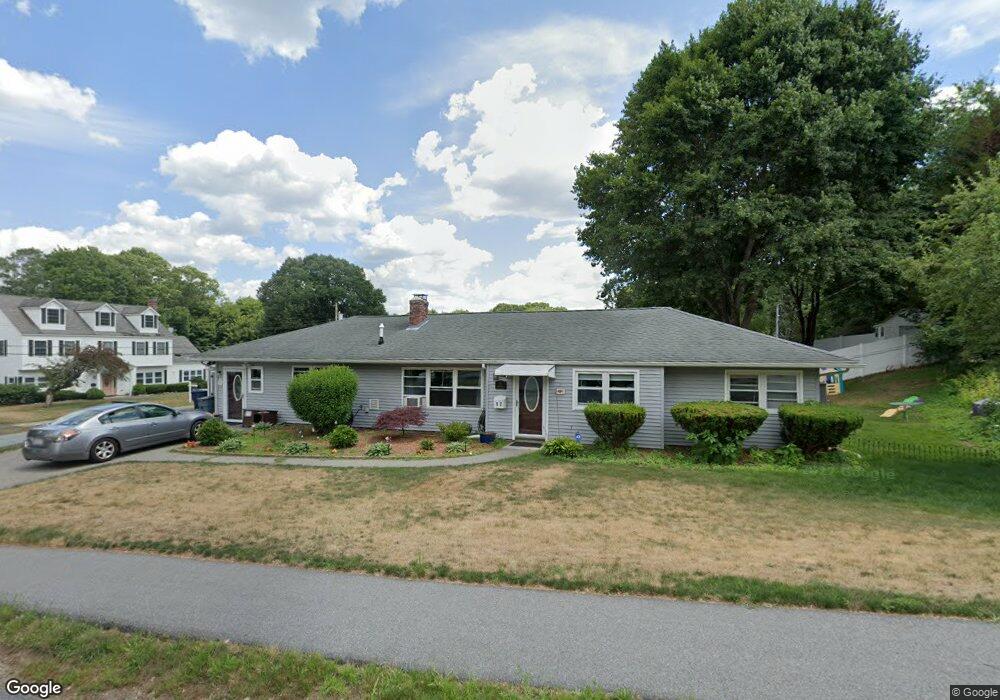
17 Leighton St Natick, MA 01760
Estimated Value: $774,000 - $994,422
3
Beds
1
Bath
1,402
Sq Ft
$625/Sq Ft
Est. Value
About This Home
This home is located at 17 Leighton St, Natick, MA 01760 and is currently estimated at $875,856, approximately $624 per square foot. 17 Leighton St is a home located in Middlesex County with nearby schools including Natick High School, Bennett-Hemenway (Ben-Hem) Elementary School, and Wilson Middle School.
Ownership History
Date
Name
Owned For
Owner Type
Purchase Details
Closed on
Jul 1, 2009
Sold by
Budocy Irt
Bought by
Wilson Eileen M
Current Estimated Value
Home Financials for this Owner
Home Financials are based on the most recent Mortgage that was taken out on this home.
Original Mortgage
$333,002
Outstanding Balance
$212,314
Interest Rate
4.86%
Mortgage Type
Purchase Money Mortgage
Estimated Equity
$663,542
Purchase Details
Closed on
Nov 4, 2008
Sold by
Goldberg Bernard L
Bought by
Budocy Irt
Create a Home Valuation Report for This Property
The Home Valuation Report is an in-depth analysis detailing your home's value as well as a comparison with similar homes in the area
Home Values in the Area
Average Home Value in this Area
Purchase History
| Date | Buyer | Sale Price | Title Company |
|---|---|---|---|
| Wilson Eileen M | $344,500 | -- | |
| Budocy Irt | -- | -- |
Source: Public Records
Mortgage History
| Date | Status | Borrower | Loan Amount |
|---|---|---|---|
| Open | Wilson Eileen M | $333,002 |
Source: Public Records
Tax History
| Year | Tax Paid | Tax Assessment Tax Assessment Total Assessment is a certain percentage of the fair market value that is determined by local assessors to be the total taxable value of land and additions on the property. | Land | Improvement |
|---|---|---|---|---|
| 2025 | $7,506 | $627,600 | $450,100 | $177,500 |
| 2024 | $7,268 | $592,800 | $425,100 | $167,700 |
| 2023 | $7,116 | $563,000 | $400,100 | $162,900 |
| 2022 | $6,894 | $516,800 | $365,100 | $151,700 |
| 2021 | $6,291 | $462,200 | $345,000 | $117,200 |
| 2020 | $9,484 | $454,700 | $330,000 | $124,700 |
| 2019 | $5,779 | $454,700 | $330,000 | $124,700 |
| 2018 | $5,106 | $391,300 | $300,000 | $91,300 |
| 2017 | $4,913 | $364,200 | $265,100 | $99,100 |
| 2016 | $4,728 | $348,400 | $250,100 | $98,300 |
| 2015 | $4,686 | $339,100 | $250,100 | $89,000 |
Source: Public Records
Map
Nearby Homes
- 3 Ferndale Rd
- 4 Richard Rd
- 14 Ferndale Rd
- 29 Irving Rd
- 8 Liberty St
- 25 Irving Rd
- 2 Darby Ct
- 35 Snake Brook Rd
- 136 Commonwealth Rd
- 16 Arlington Rd
- 57 Beverly Rd
- 293 Bacon St Unit A
- 2 Melville Place
- 7 Jackson Ct Unit B
- 45 W Plain St Unit 1
- 186 Main St
- 43 Charles St
- 41 Charles St
- 27 2nd St
- 10 Whittier Rd