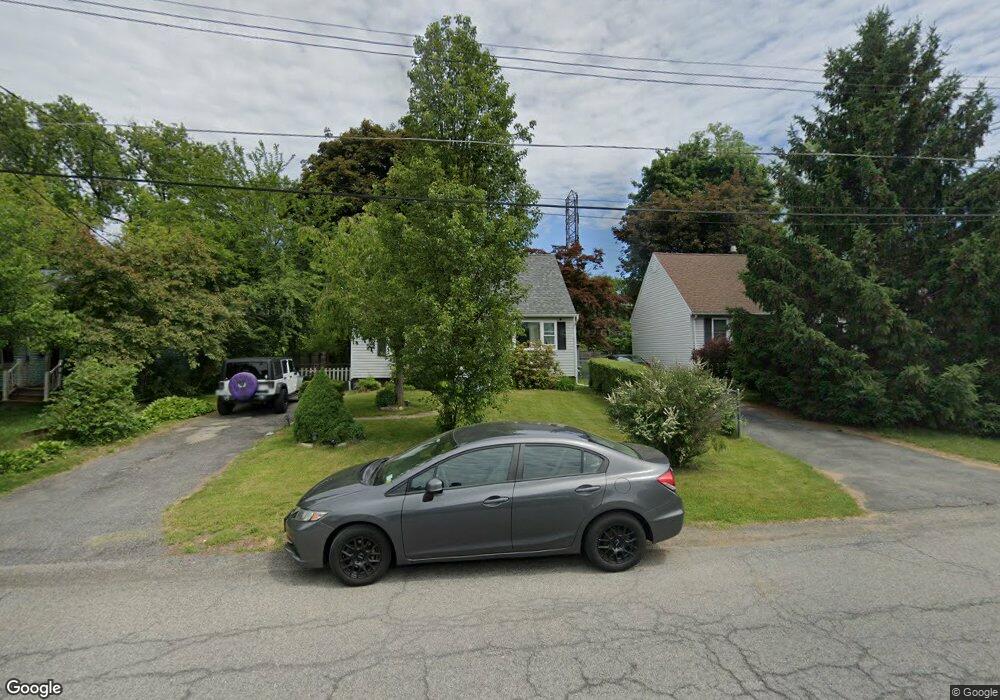
17 Lester St Albany, NY 12205
Estimated Value: $260,000 - $302,000
3
Beds
2
Baths
1,492
Sq Ft
$182/Sq Ft
Est. Value
About This Home
This home is located at 17 Lester St, Albany, NY 12205 and is currently estimated at $272,261, approximately $182 per square foot. 17 Lester St is a home located in Albany County with nearby schools including Saddlewood Elementary School, Lisha Kill Middle School, and Colonie Central High School.
Ownership History
Date
Name
Owned For
Owner Type
Purchase Details
Closed on
Dec 8, 2006
Sold by
Matthews Terrence
Bought by
Dragon Amiee
Current Estimated Value
Home Financials for this Owner
Home Financials are based on the most recent Mortgage that was taken out on this home.
Original Mortgage
$150,778
Outstanding Balance
$90,347
Interest Rate
6.35%
Mortgage Type
FHA
Estimated Equity
$181,914
Purchase Details
Closed on
Jun 22, 2006
Sold by
Sec Of Housing & Urban Dev
Bought by
Matthews Terrence
Home Financials for this Owner
Home Financials are based on the most recent Mortgage that was taken out on this home.
Original Mortgage
$80,000
Interest Rate
9.7%
Mortgage Type
Adjustable Rate Mortgage/ARM
Purchase Details
Closed on
Apr 8, 2005
Sold by
Murray Robert
Bought by
Mortgage Elec Regis Sys Inc
Create a Home Valuation Report for This Property
The Home Valuation Report is an in-depth analysis detailing your home's value as well as a comparison with similar homes in the area
Home Values in the Area
Average Home Value in this Area
Purchase History
| Date | Buyer | Sale Price | Title Company |
|---|---|---|---|
| Dragon Amiee | $152,000 | -- | |
| Dragon Amiee C | $152,000 | None Available | |
| Matthews Terrence | $101,000 | -- | |
| Matthews Terrence A | $101,000 | None Available | |
| Mortgage Elec Regis Sys Inc | $73,382 | -- |
Source: Public Records
Mortgage History
| Date | Status | Borrower | Loan Amount |
|---|---|---|---|
| Open | Dragon Amiee C | $150,778 | |
| Closed | Dragon Amiee | $150,778 | |
| Previous Owner | Matthews Terrence A | $80,000 |
Source: Public Records
Tax History Compared to Growth
Tax History
| Year | Tax Paid | Tax Assessment Tax Assessment Total Assessment is a certain percentage of the fair market value that is determined by local assessors to be the total taxable value of land and additions on the property. | Land | Improvement |
|---|---|---|---|---|
| 2024 | $3,779 | $79,500 | $15,900 | $63,600 |
| 2023 | $3,660 | $79,500 | $15,900 | $63,600 |
| 2022 | $3,580 | $79,500 | $15,900 | $63,600 |
| 2021 | $3,533 | $79,500 | $15,900 | $63,600 |
| 2020 | $3,068 | $79,500 | $15,900 | $63,600 |
| 2019 | $1,670 | $79,500 | $15,900 | $63,600 |
| 2018 | $2,980 | $79,500 | $15,900 | $63,600 |
| 2017 | $0 | $79,500 | $15,900 | $63,600 |
| 2016 | $2,866 | $79,500 | $15,900 | $63,600 |
| 2015 | -- | $79,500 | $15,900 | $63,600 |
| 2014 | -- | $79,500 | $15,900 | $63,600 |
Source: Public Records
Map
Nearby Homes