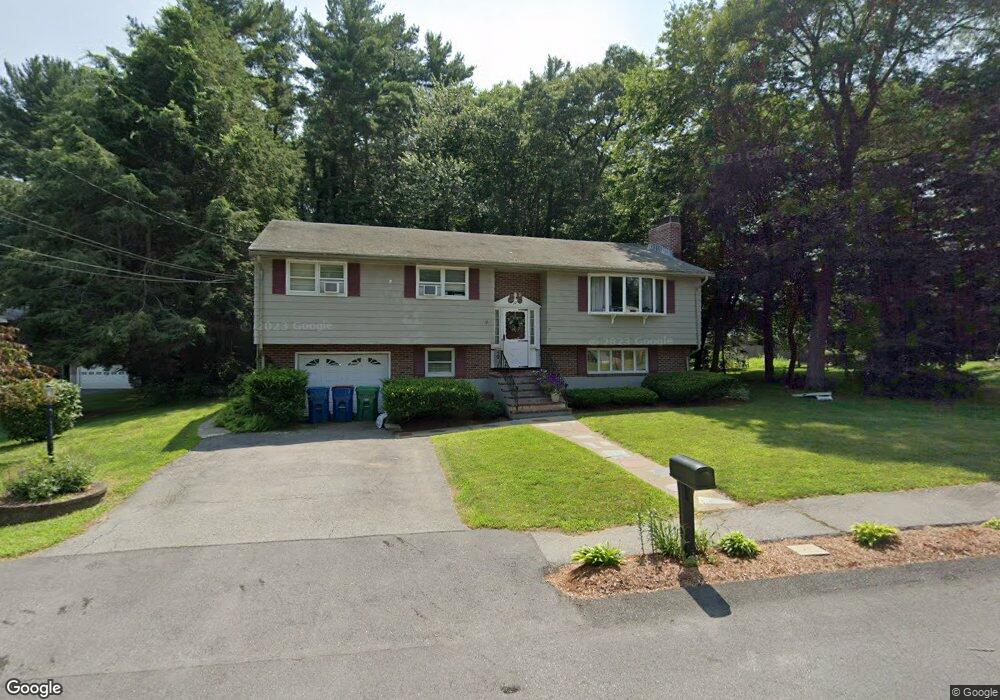
17 Lisa St Burlington, MA 01803
North Burlington NeighborhoodEstimated Value: $762,000 - $879,000
3
Beds
2
Baths
2,168
Sq Ft
$385/Sq Ft
Est. Value
About This Home
This home is located at 17 Lisa St, Burlington, MA 01803 and is currently estimated at $833,793, approximately $384 per square foot. 17 Lisa St is a home located in Middlesex County with nearby schools including Burlington High School, Fox Hill, and Marshall Simonds Middle School.
Ownership History
Date
Name
Owned For
Owner Type
Purchase Details
Closed on
Sep 23, 2021
Sold by
Smith George A
Bought by
Smith Lt
Current Estimated Value
Purchase Details
Closed on
Apr 1, 1969
Bought by
Smith George and Smith Gloria J
Create a Home Valuation Report for This Property
The Home Valuation Report is an in-depth analysis detailing your home's value as well as a comparison with similar homes in the area
Home Values in the Area
Average Home Value in this Area
Purchase History
| Date | Buyer | Sale Price | Title Company |
|---|---|---|---|
| Smith Lt | -- | None Available | |
| Smith George | -- | -- |
Source: Public Records
Tax History
| Year | Tax Paid | Tax Assessment Tax Assessment Total Assessment is a certain percentage of the fair market value that is determined by local assessors to be the total taxable value of land and additions on the property. | Land | Improvement |
|---|---|---|---|---|
| 2025 | $6,136 | $708,500 | $427,600 | $280,900 |
| 2024 | $5,950 | $665,500 | $405,300 | $260,200 |
| 2023 | $5,708 | $607,200 | $352,300 | $254,900 |
| 2022 | $5,596 | $562,400 | $321,300 | $241,100 |
| 2021 | $5,307 | $533,400 | $292,300 | $241,100 |
| 2020 | $5,161 | $535,400 | $292,300 | $243,100 |
| 2019 | $5,137 | $490,200 | $273,300 | $216,900 |
| 2018 | $4,794 | $451,400 | $260,300 | $191,100 |
| 2017 | $4,694 | $451,400 | $260,300 | $191,100 |
| 2016 | $4,656 | $406,300 | $222,300 | $184,000 |
| 2015 | $4,612 | $406,300 | $222,300 | $184,000 |
| 2014 | $4,484 | $373,700 | $202,300 | $171,400 |
Source: Public Records
Map
Nearby Homes
Your Personal Tour Guide
Ask me questions while you tour the home.