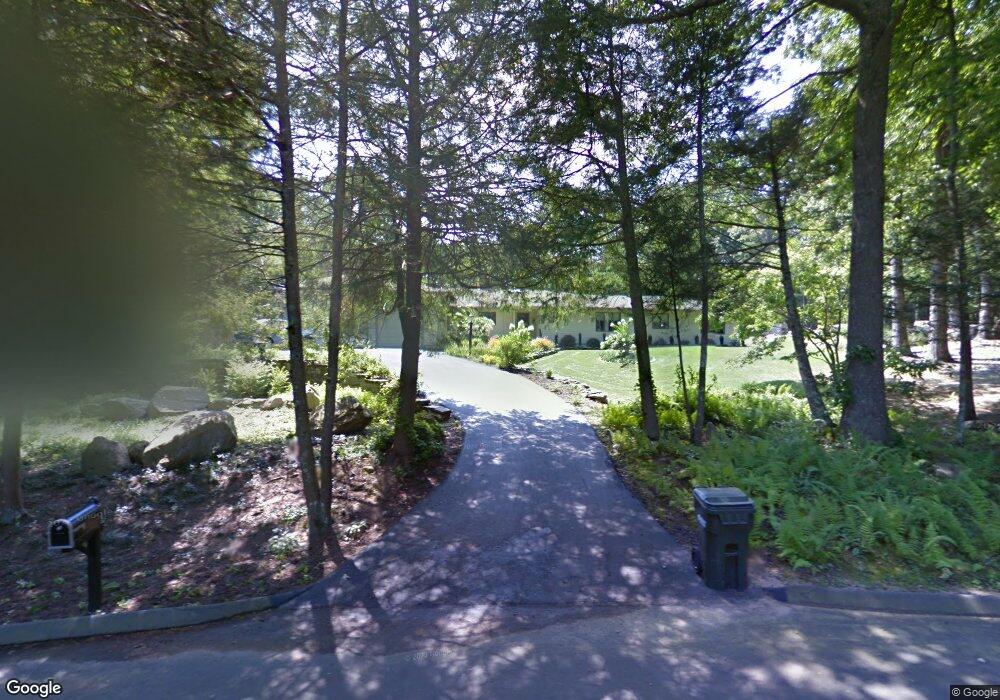
17 Lobb Rd Deep River, CT 06417
Estimated Value: $750,239 - $1,059,000
3
Beds
3
Baths
3,446
Sq Ft
$253/Sq Ft
Est. Value
About This Home
This home is located at 17 Lobb Rd, Deep River, CT 06417 and is currently estimated at $872,810, approximately $253 per square foot. 17 Lobb Rd is a home located in Middlesex County with nearby schools including Valley Regional High School.
Ownership History
Date
Name
Owned For
Owner Type
Purchase Details
Closed on
Jul 30, 2008
Sold by
Cahill Mary
Bought by
Greaves Sandra
Current Estimated Value
Home Financials for this Owner
Home Financials are based on the most recent Mortgage that was taken out on this home.
Original Mortgage
$250,000
Outstanding Balance
$164,521
Interest Rate
6.47%
Estimated Equity
$708,289
Create a Home Valuation Report for This Property
The Home Valuation Report is an in-depth analysis detailing your home's value as well as a comparison with similar homes in the area
Home Values in the Area
Average Home Value in this Area
Purchase History
| Date | Buyer | Sale Price | Title Company |
|---|---|---|---|
| Greaves Sandra | $510,000 | -- |
Source: Public Records
Mortgage History
| Date | Status | Borrower | Loan Amount |
|---|---|---|---|
| Open | Greaves Sandra | $250,000 | |
| Previous Owner | Greaves Sandra | $215,000 |
Source: Public Records
Tax History
| Year | Tax Paid | Tax Assessment Tax Assessment Total Assessment is a certain percentage of the fair market value that is determined by local assessors to be the total taxable value of land and additions on the property. | Land | Improvement |
|---|---|---|---|---|
| 2025 | $11,291 | $353,080 | $63,000 | $290,080 |
| 2024 | $10,987 | $350,140 | $63,000 | $287,140 |
| 2023 | $10,462 | $350,140 | $63,000 | $287,140 |
| 2022 | $10,147 | $350,140 | $63,000 | $287,140 |
| 2021 | $10,328 | $349,160 | $63,000 | $286,160 |
| 2020 | $9,273 | $309,190 | $63,000 | $246,190 |
| 2019 | $9,096 | $309,190 | $63,000 | $246,190 |
| 2018 | $5,856 | $309,190 | $63,000 | $246,190 |
| 2017 | $5,885 | $303,310 | $63,000 | $240,310 |
| 2016 | $8,350 | $303,310 | $63,000 | $240,310 |
| 2015 | $8,707 | $331,310 | $70,000 | $261,310 |
| 2014 | $8,574 | $331,310 | $70,000 | $261,310 |
Source: Public Records
Map
Nearby Homes
- 252 River Rd
- 134 Meadow Woods Rd
- 134 River Rd
- 21 River Ln
- 62 River St
- 41B River Rd
- 209 Main St
- 163 Main St
- 85 River Rd Unit B7
- 92 Main St Unit 101
- 11 Winter Ave
- 46 Hemlock Dr
- 33 Deep River Rd
- 214 Kelsey Hill Rd
- 31 N Main St
- 16 N Main St
- 79 Middlesex Ave
- 11 N Main St
- 35 Prospect St
- 153 Mitchell Hill Rd
Your Personal Tour Guide
Ask me questions while you tour the home.