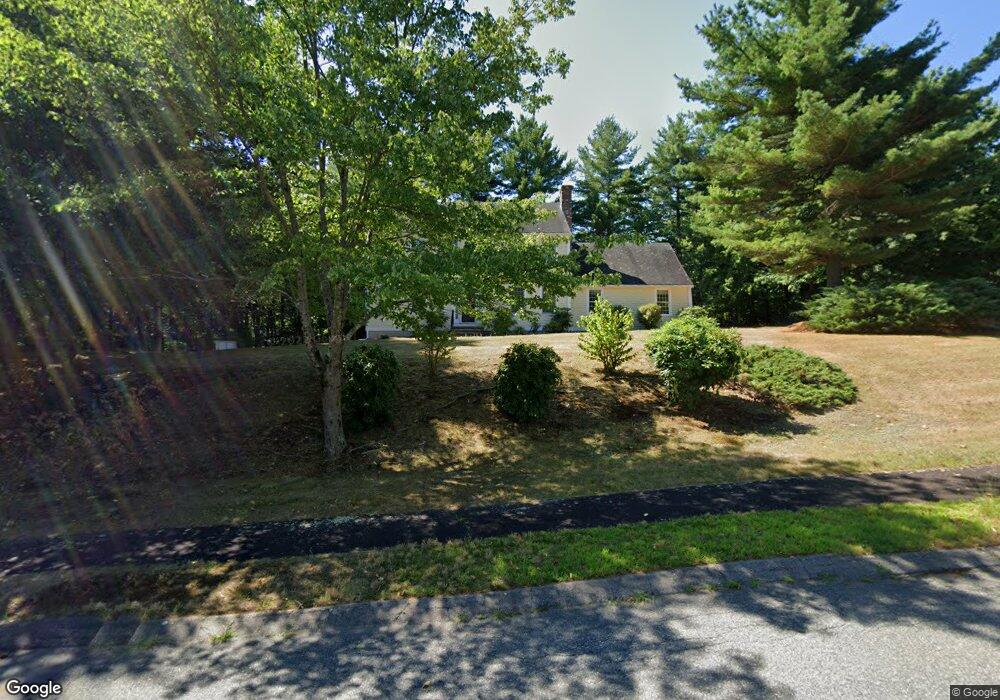
17 Longwood Dr Hopkinton, MA 01748
Estimated Value: $1,043,382 - $1,230,000
4
Beds
3
Baths
2,840
Sq Ft
$391/Sq Ft
Est. Value
About This Home
This home is located at 17 Longwood Dr, Hopkinton, MA 01748 and is currently estimated at $1,110,596, approximately $391 per square foot. 17 Longwood Dr is a home located in Middlesex County with nearby schools including Elmwood Elementary School, Hopkins Elementary School, and Marathon Elementary School.
Ownership History
Date
Name
Owned For
Owner Type
Purchase Details
Closed on
Jul 15, 2009
Sold by
Slack Julie L
Bought by
Chakraborty Ashish and Chakraborty Nandini
Current Estimated Value
Purchase Details
Closed on
Jul 16, 2001
Sold by
Curry Laura K
Bought by
Slack Julie L
Purchase Details
Closed on
Nov 24, 1997
Sold by
Kennally James M and Kennally Carole B
Bought by
Serpico Dean J and Serpico Laura K
Purchase Details
Closed on
Nov 2, 1992
Sold by
Pheasant Hl Rlty Dev
Bought by
Kennally James M and Kennally Carole B
Create a Home Valuation Report for This Property
The Home Valuation Report is an in-depth analysis detailing your home's value as well as a comparison with similar homes in the area
Home Values in the Area
Average Home Value in this Area
Purchase History
| Date | Buyer | Sale Price | Title Company |
|---|---|---|---|
| Chakraborty Ashish | $527,000 | -- | |
| Slack Julie L | $422,000 | -- | |
| Serpico Dean J | $320,000 | -- | |
| Kennally James M | $215,900 | -- |
Source: Public Records
Mortgage History
| Date | Status | Borrower | Loan Amount |
|---|---|---|---|
| Open | Kennally James M | $409,000 | |
| Closed | Kennally James M | $413,000 |
Source: Public Records
Tax History Compared to Growth
Tax History
| Year | Tax Paid | Tax Assessment Tax Assessment Total Assessment is a certain percentage of the fair market value that is determined by local assessors to be the total taxable value of land and additions on the property. | Land | Improvement |
|---|---|---|---|---|
| 2025 | $13,512 | $952,900 | $366,200 | $586,700 |
| 2024 | $12,475 | $853,900 | $348,800 | $505,100 |
| 2023 | $11,154 | $705,500 | $306,500 | $399,000 |
| 2022 | $10,981 | $644,800 | $279,100 | $365,700 |
| 2021 | $10,685 | $625,600 | $270,800 | $354,800 |
| 2020 | $10,245 | $609,100 | $264,700 | $344,400 |
| 2019 | $9,746 | $567,600 | $254,700 | $312,900 |
| 2018 | $9,256 | $547,700 | $242,900 | $304,800 |
| 2017 | $8,934 | $531,800 | $236,300 | $295,500 |
| 2016 | $8,830 | $518,500 | $231,600 | $286,900 |
| 2015 | $8,861 | $493,400 | $225,100 | $268,300 |
Source: Public Records
Map
Nearby Homes