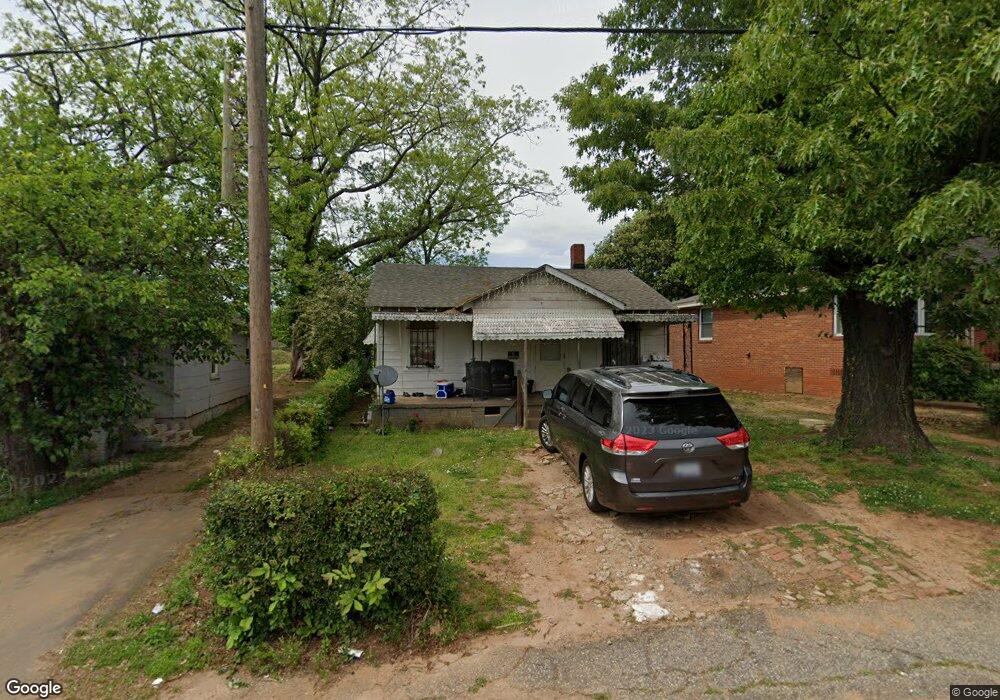
17 Loop St Greenville, SC 29609
North Greenville NeighborhoodEstimated Value: $125,508 - $269,000
2
Beds
1
Bath
980
Sq Ft
$204/Sq Ft
Est. Value
About This Home
This home is located at 17 Loop St, Greenville, SC 29609 and is currently estimated at $199,627, approximately $203 per square foot. 17 Loop St is a home located in Greenville County with nearby schools including Summit Drive Elementary School, League Academy, and Berea High School.
Ownership History
Date
Name
Owned For
Owner Type
Purchase Details
Closed on
Dec 23, 2013
Sold by
Bingham Johnny H
Bought by
Perez Eusebia Hernandez
Current Estimated Value
Purchase Details
Closed on
Sep 17, 2012
Sold by
Bingham Johnny H
Bought by
Bingham Johnny H
Purchase Details
Closed on
Jul 2, 2012
Sold by
Hudson Michael D
Bought by
Bingham Johnny H
Purchase Details
Closed on
Dec 1, 2009
Sold by
Hudson Michael D
Bought by
Hudson Michael D and Bowling Cynthia N
Purchase Details
Closed on
Apr 18, 2008
Sold by
Bowling Cynthia N and Hudson Ronnie Carole Bowling
Bought by
Hudson Michael D
Create a Home Valuation Report for This Property
The Home Valuation Report is an in-depth analysis detailing your home's value as well as a comparison with similar homes in the area
Home Values in the Area
Average Home Value in this Area
Purchase History
| Date | Buyer | Sale Price | Title Company |
|---|---|---|---|
| Perez Eusebia Hernandez | $18,000 | -- | |
| Bingham Johnny H | -- | -- | |
| Bingham Johnny H | $18,000 | -- | |
| Hudson Michael D | -- | -- | |
| Hudson Michael D | -- | -- |
Source: Public Records
Tax History
| Year | Tax Paid | Tax Assessment Tax Assessment Total Assessment is a certain percentage of the fair market value that is determined by local assessors to be the total taxable value of land and additions on the property. | Land | Improvement |
|---|---|---|---|---|
| 2025 | $1,052 | $2,300 | $550 | $1,750 |
| 2024 | $1,052 | $2,000 | $360 | $1,640 |
| 2023 | $1,019 | $2,000 | $360 | $1,640 |
| 2022 | $985 | $2,000 | $360 | $1,640 |
| 2021 | $977 | $2,000 | $360 | $1,640 |
| 2020 | $1,119 | $2,240 | $360 | $1,880 |
| 2019 | $1,102 | $2,240 | $360 | $1,880 |
| 2018 | $1,027 | $2,240 | $360 | $1,880 |
| 2017 | $1,015 | $2,240 | $360 | $1,880 |
| 2016 | $956 | $37,380 | $6,000 | $31,380 |
| 2015 | $956 | $37,380 | $6,000 | $31,380 |
| 2014 | $879 | $33,989 | $4,957 | $29,032 |
Source: Public Records
Map
Nearby Homes
- 407 Old Paris Mountain Rd
- 34 Happy Ave
- 0 Foster St Unit Foster Street
- 8 Cotton St
- 224 Orange St
- 22 Cotton St
- 210 W Mountainview Ave
- 111 Hammett St
- 12 Hudson St
- 13 Glass St
- 11 Glass St
- 9 Glass St
- 105 Burgess Ave
- 221 Buist Ave
- 46 W Hillcrest Dr
- 12 Elrod St
- 10 Elrod St
- 726 Rutherford Rd
- 15A Oakhurst Ave
- 14 Elrod St
Your Personal Tour Guide
Ask me questions while you tour the home.