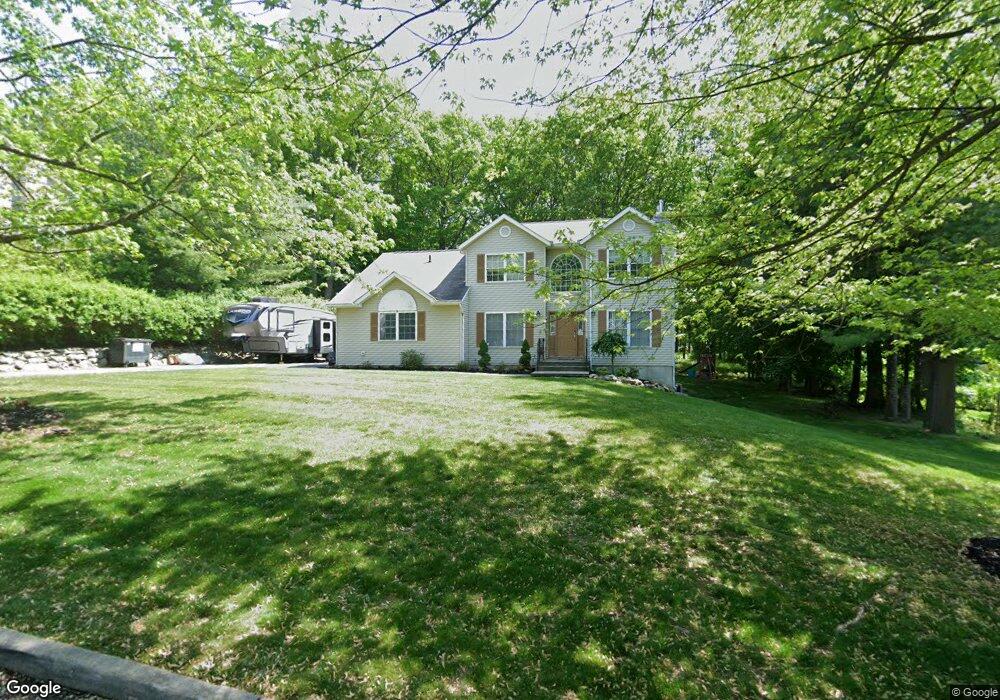
17 Lori Ct Spring Valley, NY 10977
Estimated Value: $872,892 - $1,060,000
5
Beds
3
Baths
2,099
Sq Ft
$450/Sq Ft
Est. Value
About This Home
This home is located at 17 Lori Ct, Spring Valley, NY 10977 and is currently estimated at $943,723, approximately $449 per square foot. 17 Lori Ct is a home located in Rockland County with nearby schools including Hempstead Elementary School, Pomona Middle School, and Ramapo High School.
Ownership History
Date
Name
Owned For
Owner Type
Purchase Details
Closed on
Dec 14, 2022
Sold by
Moskovits Joseph
Bought by
Surkis David
Current Estimated Value
Home Financials for this Owner
Home Financials are based on the most recent Mortgage that was taken out on this home.
Original Mortgage
$544,500
Outstanding Balance
$528,546
Interest Rate
7.08%
Mortgage Type
New Conventional
Estimated Equity
$415,177
Purchase Details
Closed on
May 23, 2007
Create a Home Valuation Report for This Property
The Home Valuation Report is an in-depth analysis detailing your home's value as well as a comparison with similar homes in the area
Home Values in the Area
Average Home Value in this Area
Purchase History
| Date | Buyer | Sale Price | Title Company |
|---|---|---|---|
| Surkis David | $605,000 | Land Track Title | |
| -- | $454,385 | -- |
Source: Public Records
Mortgage History
| Date | Status | Borrower | Loan Amount |
|---|---|---|---|
| Open | Surkis David | $544,500 |
Source: Public Records
Tax History
| Year | Tax Paid | Tax Assessment Tax Assessment Total Assessment is a certain percentage of the fair market value that is determined by local assessors to be the total taxable value of land and additions on the property. | Land | Improvement |
|---|---|---|---|---|
| 2024 | $14,529 | $61,600 | $22,000 | $39,600 |
| 2023 | $14,529 | $61,600 | $22,000 | $39,600 |
| 2022 | $13,428 | $61,600 | $22,000 | $39,600 |
| 2021 | $13,427 | $61,600 | $22,000 | $39,600 |
| 2020 | $13,966 | $61,600 | $22,000 | $39,600 |
| 2019 | $14,378 | $61,600 | $22,000 | $39,600 |
| 2018 | $14,378 | $61,600 | $22,000 | $39,600 |
| 2017 | $14,029 | $61,600 | $22,000 | $39,600 |
| 2016 | $12,974 | $61,600 | $22,000 | $39,600 |
| 2015 | -- | $61,600 | $22,000 | $39,600 |
| 2014 | -- | $61,600 | $22,000 | $39,600 |
Source: Public Records
Map
Nearby Homes
- 9 Westminster Way
- 109 Pomona Rd
- 158 Summit Park Rd
- 12 Park Ave
- 6 Pennington Way
- 6 Argo Ln
- 2 Windsor Cir
- 43 Conklin Rd
- 8 Windsor Cir Unit A4
- 30 Argo Ln
- 189 Mc Namara Rd
- 161 Mcnamara Rd
- 16 Dessau Cir
- 23 Dessau Cir Unit 37
- 9 Aron Ct
- 63 Dessau Cir Unit 52
- 59 Dessau Cir
- 57 Dessau Cir
- 6 Adele Blvd
- 4 Beaver Dam Rd
Your Personal Tour Guide
Ask me questions while you tour the home.