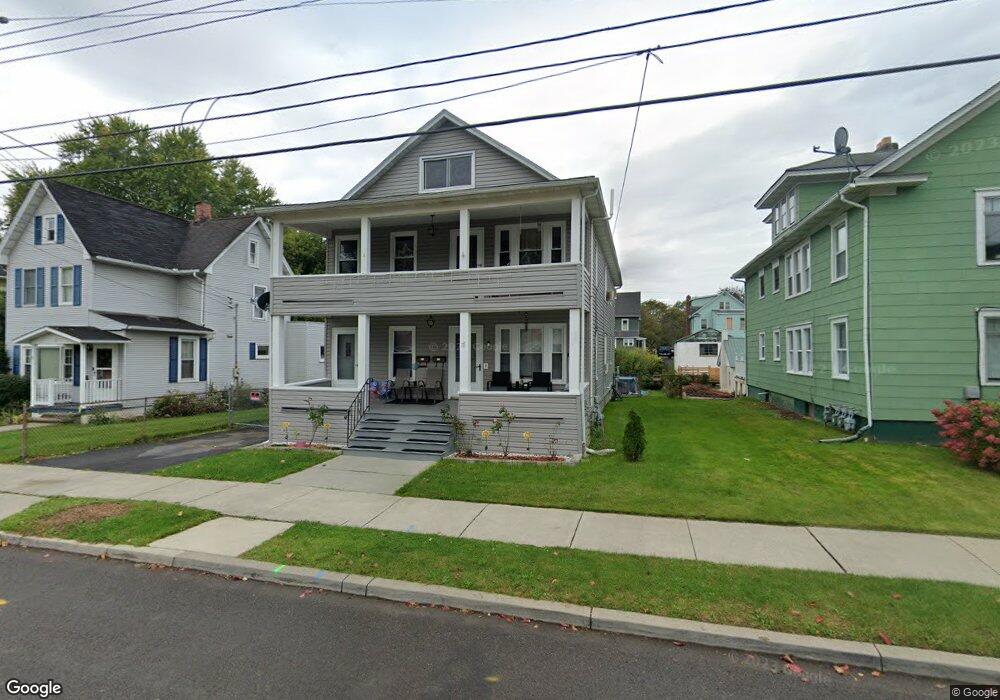
17 Louisa St Binghamton, NY 13904
Eastside Binghamton NeighborhoodEstimated Value: $136,000 - $229,000
4
Beds
2
Baths
2,444
Sq Ft
$69/Sq Ft
Est. Value
About This Home
This home is located at 17 Louisa St, Binghamton, NY 13904 and is currently estimated at $167,701, approximately $68 per square foot. 17 Louisa St is a home located in Broome County with nearby schools including Calvin Coolidge Elementary School, Binghamton High School, and East Middle School.
Ownership History
Date
Name
Owned For
Owner Type
Purchase Details
Closed on
Sep 22, 2022
Sold by
Ely Rhonda and Basos Rhonda L
Bought by
Lorie Nora E
Current Estimated Value
Home Financials for this Owner
Home Financials are based on the most recent Mortgage that was taken out on this home.
Original Mortgage
$88,000
Outstanding Balance
$83,992
Interest Rate
5.13%
Mortgage Type
New Conventional
Estimated Equity
$83,709
Purchase Details
Closed on
May 29, 2009
Sold by
Kostun
Bought by
Ely Rhonda
Purchase Details
Closed on
Sep 3, 1997
Purchase Details
Closed on
Apr 30, 1996
Create a Home Valuation Report for This Property
The Home Valuation Report is an in-depth analysis detailing your home's value as well as a comparison with similar homes in the area
Home Values in the Area
Average Home Value in this Area
Purchase History
| Date | Buyer | Sale Price | Title Company |
|---|---|---|---|
| Lorie Nora E | $110,000 | None Available | |
| Ely Rhonda | -- | -- | |
| -- | $15,000 | -- | |
| Frank Kostun | $51,000 | -- | |
| -- | -- | -- |
Source: Public Records
Mortgage History
| Date | Status | Borrower | Loan Amount |
|---|---|---|---|
| Open | Lorie Nora E | $88,000 |
Source: Public Records
Tax History Compared to Growth
Tax History
| Year | Tax Paid | Tax Assessment Tax Assessment Total Assessment is a certain percentage of the fair market value that is determined by local assessors to be the total taxable value of land and additions on the property. | Land | Improvement |
|---|---|---|---|---|
| 2024 | $7,392 | $75,000 | $11,000 | $64,000 |
| 2023 | $7,257 | $75,000 | $11,000 | $64,000 |
| 2022 | $7,086 | $75,000 | $11,000 | $64,000 |
| 2021 | $7,007 | $75,000 | $11,000 | $64,000 |
| 2020 | $3,962 | $75,000 | $11,000 | $64,000 |
| 2019 | $2,365 | $75,000 | $11,000 | $64,000 |
| 2018 | $3,847 | $75,000 | $11,000 | $64,000 |
| 2017 | $3,883 | $75,000 | $11,000 | $64,000 |
| 2016 | $3,914 | $75,000 | $11,000 | $64,000 |
| 2015 | $3,478 | $75,000 | $11,000 | $64,000 |
| 2014 | $3,478 | $75,000 | $11,000 | $64,000 |
Source: Public Records
Map
Nearby Homes