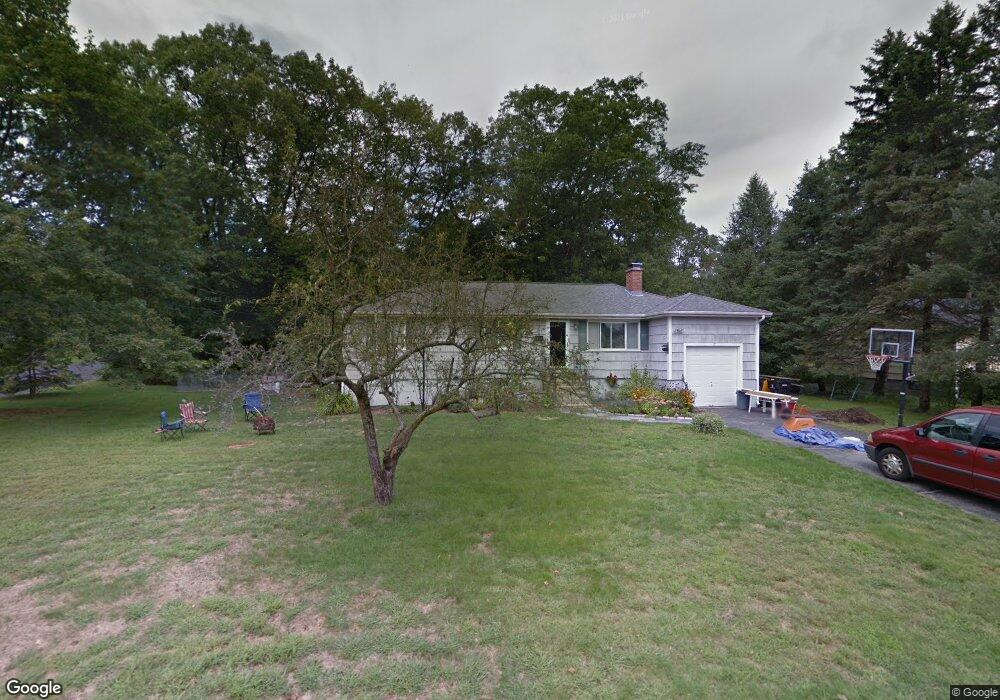
17 Lyman Rd Framingham, MA 01701
Nobscot NeighborhoodEstimated Value: $657,263 - $776,000
3
Beds
2
Baths
1,248
Sq Ft
$573/Sq Ft
Est. Value
About This Home
This home is located at 17 Lyman Rd, Framingham, MA 01701 and is currently estimated at $715,566, approximately $573 per square foot. 17 Lyman Rd is a home located in Middlesex County with nearby schools including Framingham High School, MetroWest Jewish Day School, and Summit Montessori School.
Ownership History
Date
Name
Owned For
Owner Type
Purchase Details
Closed on
Apr 29, 1993
Sold by
Lyford Daniel E and Lyford Connie-Sue
Bought by
Eagan Yvette M and Wells Peter F
Current Estimated Value
Home Financials for this Owner
Home Financials are based on the most recent Mortgage that was taken out on this home.
Original Mortgage
$125,200
Interest Rate
7.51%
Mortgage Type
Purchase Money Mortgage
Purchase Details
Closed on
Aug 1, 1989
Sold by
Mcgeoch George P
Bought by
Lyford Daniel E
Home Financials for this Owner
Home Financials are based on the most recent Mortgage that was taken out on this home.
Original Mortgage
$132,000
Interest Rate
9.9%
Mortgage Type
Purchase Money Mortgage
Create a Home Valuation Report for This Property
The Home Valuation Report is an in-depth analysis detailing your home's value as well as a comparison with similar homes in the area
Home Values in the Area
Average Home Value in this Area
Purchase History
| Date | Buyer | Sale Price | Title Company |
|---|---|---|---|
| Eagan Yvette M | $156,500 | -- | |
| Eagan Yvette M | $156,500 | -- | |
| Lyford Daniel E | $165,000 | -- | |
| Lyford Daniel E | $165,000 | -- |
Source: Public Records
Mortgage History
| Date | Status | Borrower | Loan Amount |
|---|---|---|---|
| Closed | Lyford Daniel E | $125,200 | |
| Previous Owner | Lyford Daniel E | $121,000 | |
| Previous Owner | Lyford Daniel E | $132,000 |
Source: Public Records
Tax History
| Year | Tax Paid | Tax Assessment Tax Assessment Total Assessment is a certain percentage of the fair market value that is determined by local assessors to be the total taxable value of land and additions on the property. | Land | Improvement |
|---|---|---|---|---|
| 2025 | $7,379 | $618,000 | $271,700 | $346,300 |
| 2024 | $7,136 | $572,700 | $242,700 | $330,000 |
| 2023 | $6,773 | $517,400 | $216,600 | $300,800 |
| 2022 | $6,414 | $466,800 | $196,500 | $270,300 |
| 2021 | $6,237 | $443,900 | $188,900 | $255,000 |
| 2020 | $6,280 | $419,200 | $171,700 | $247,500 |
| 2019 | $6,147 | $399,700 | $171,700 | $228,000 |
| 2018 | $5,640 | $345,600 | $165,200 | $180,400 |
| 2017 | $5,237 | $313,400 | $160,400 | $153,000 |
| 2016 | $4,863 | $279,800 | $160,400 | $119,400 |
| 2015 | $4,867 | $273,100 | $160,900 | $112,200 |
Source: Public Records
Map
Nearby Homes
- 32 Lyman Rd
- 44 Agnes Dr
- 484 Edgell Rd
- 472 Brook St
- 51 Woodland Dr
- 5 Lavelle Ln
- 2 Hemenway Rd
- 16 Bayberry Ln
- 401 Belknap Rd
- 11 Bellwood Way
- 1060 Grove St Unit 31
- 1060 Grove St Unit 23
- 1060 Grove St Unit 43
- 1060 Grove St Unit 24
- 2 Grove St
- 15 Woodmere Rd
- 356 Central St
- 10 Rolling Ln
- 19 Rolling Ln
- 620 Edmands Rd
Your Personal Tour Guide
Ask me questions while you tour the home.