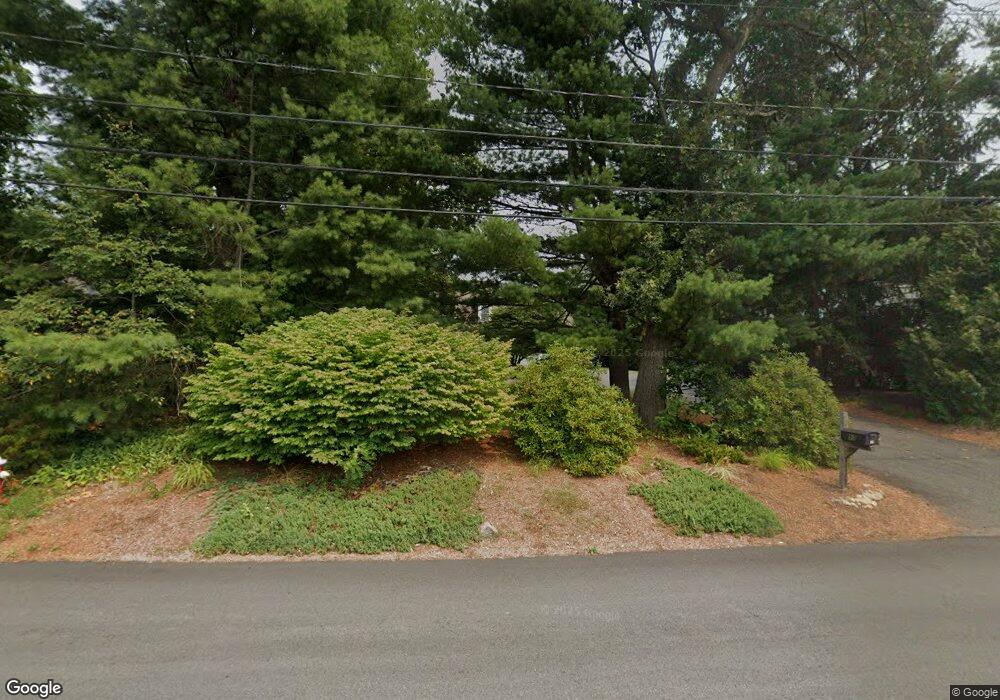
17 Main Cir Shrewsbury, MA 01545
Estimated Value: $927,755 - $1,132,000
4
Beds
3
Baths
3,214
Sq Ft
$324/Sq Ft
Est. Value
About This Home
This home is located at 17 Main Cir, Shrewsbury, MA 01545 and is currently estimated at $1,042,439, approximately $324 per square foot. 17 Main Cir is a home located in Worcester County with nearby schools including Floral Street School, Sherwood Middle School, and Oak Middle School.
Ownership History
Date
Name
Owned For
Owner Type
Purchase Details
Closed on
May 16, 2008
Sold by
Cartus Financial Corp and Lofgren
Bought by
Barner Craig and Barner Kelly K
Current Estimated Value
Purchase Details
Closed on
Dec 22, 2006
Sold by
Lofgren Funding T and Lofgren
Bought by
Hooper Donald F and Hooper Sandra E
Purchase Details
Closed on
Mar 9, 2006
Sold by
Guerra-Lofgren Jacqueline and Lofgren Joseph D
Bought by
Lofgen Jacqueline G and Lofgen Joseph D
Purchase Details
Closed on
Feb 29, 2000
Sold by
Brady Gerald T and Brady Paula E
Bought by
Lofgren Joseph D and Lofgren Jacqueline G
Purchase Details
Closed on
Dec 27, 1994
Sold by
Dauginikas Helen M
Bought by
Brady Gerald T and Brady Paula E
Create a Home Valuation Report for This Property
The Home Valuation Report is an in-depth analysis detailing your home's value as well as a comparison with similar homes in the area
Home Values in the Area
Average Home Value in this Area
Purchase History
| Date | Buyer | Sale Price | Title Company |
|---|---|---|---|
| Barner Craig | $525,000 | -- | |
| Barner Craig | $525,000 | -- | |
| Barner Craig | $525,000 | -- | |
| Cartus Financial Corp | $525,000 | -- | |
| Cartus Financial Corp | $525,000 | -- | |
| Hooper Donald F | $8,000 | -- | |
| Hooper Donald F | $8,000 | -- | |
| Hooper Donald F | $8,000 | -- | |
| Lofgen Jacqueline G | -- | -- | |
| Lofgen Jacqueline G | -- | -- | |
| Lofgen Jacqueline G | -- | -- | |
| Lofgren Joseph D | $351,000 | -- | |
| Lofgren Joseph D | $351,000 | -- | |
| Brady Gerald T | $65,000 | -- | |
| Brady Gerald T | $65,000 | -- |
Source: Public Records
Mortgage History
| Date | Status | Borrower | Loan Amount |
|---|---|---|---|
| Open | Barner S C | $285,700 | |
| Closed | Brady Gerald T | $300,000 | |
| Closed | Brady Gerald T | $408,000 |
Source: Public Records
Tax History Compared to Growth
Tax History
| Year | Tax Paid | Tax Assessment Tax Assessment Total Assessment is a certain percentage of the fair market value that is determined by local assessors to be the total taxable value of land and additions on the property. | Land | Improvement |
|---|---|---|---|---|
| 2025 | $99 | $822,400 | $266,300 | $556,100 |
| 2024 | $9,259 | $747,900 | $253,600 | $494,300 |
| 2023 | $8,626 | $657,500 | $253,600 | $403,900 |
| 2022 | $9,370 | $664,100 | $253,600 | $410,500 |
| 2021 | $7,443 | $564,300 | $202,900 | $361,400 |
| 2020 | $7,037 | $564,300 | $202,900 | $361,400 |
| 2019 | $6,699 | $532,900 | $186,900 | $346,000 |
| 2018 | $6,796 | $536,800 | $179,800 | $357,000 |
| 2017 | $6,675 | $520,300 | $163,300 | $357,000 |
| 2016 | $6,738 | $518,300 | $153,600 | $364,700 |
| 2015 | $6,579 | $498,400 | $149,100 | $349,300 |
Source: Public Records
Map
Nearby Homes