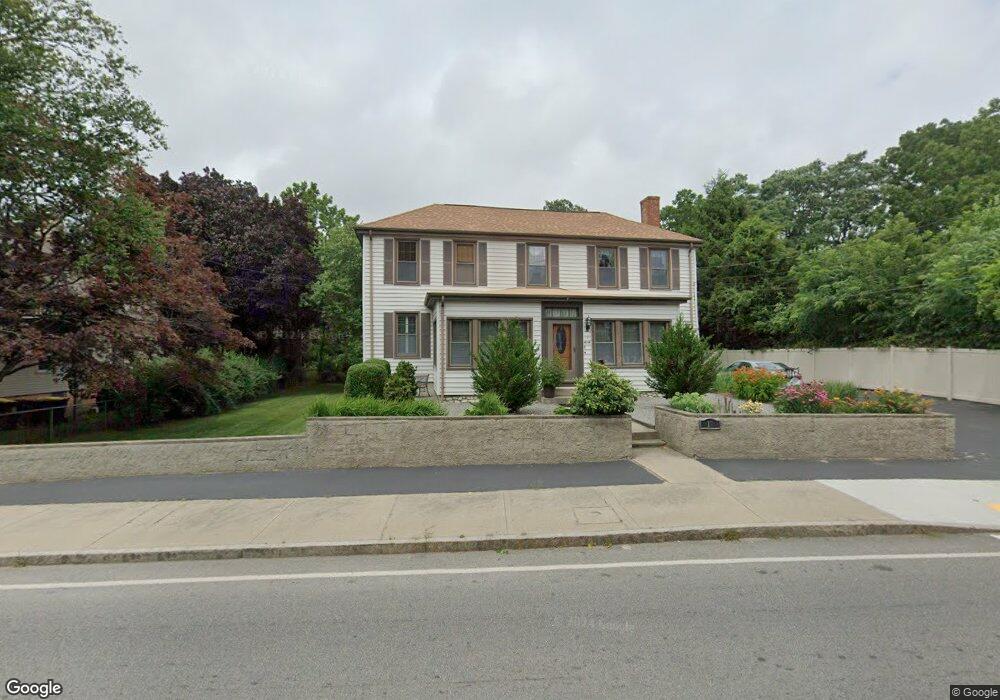
17 Main St Acushnet, MA 02743
Upper Acushnet NeighborhoodEstimated Value: $626,000 - $747,000
Studio
3
Baths
3,244
Sq Ft
$210/Sq Ft
Est. Value
About This Home
This home is located at 17 Main St, Acushnet, MA 02743 and is currently estimated at $682,152, approximately $210 per square foot. 17 Main St is a home located in Bristol County with nearby schools including Acushnet Elementary School, Albert F Ford Middle School, and Alma Del Mar Charter School.
Ownership History
Date
Name
Owned For
Owner Type
Purchase Details
Closed on
Jun 19, 1991
Sold by
Bussiere Denis G and Bussiere Diane T
Bought by
Fernandes Manuel F and Fernandes Zelia F
Current Estimated Value
Create a Home Valuation Report for This Property
The Home Valuation Report is an in-depth analysis detailing your home's value as well as a comparison with similar homes in the area
Home Values in the Area
Average Home Value in this Area
Purchase History
| Date | Buyer | Sale Price | Title Company |
|---|---|---|---|
| Fernandes Manuel F | $155,000 | -- |
Source: Public Records
Mortgage History
| Date | Status | Borrower | Loan Amount |
|---|---|---|---|
| Open | Fernandes Manuel F | $248,000 | |
| Closed | Fernandes Manuel F | $283,185 | |
| Closed | Fernandes Manuel F | $80,000 | |
| Closed | Fernandes Manuel F | $75,000 |
Source: Public Records
Tax History
| Year | Tax Paid | Tax Assessment Tax Assessment Total Assessment is a certain percentage of the fair market value that is determined by local assessors to be the total taxable value of land and additions on the property. | Land | Improvement |
|---|---|---|---|---|
| 2025 | $62 | $571,000 | $132,900 | $438,100 |
| 2024 | $5,366 | $470,300 | $125,900 | $344,400 |
| 2023 | $5,267 | $438,900 | $114,200 | $324,700 |
| 2022 | $5,328 | $401,500 | $107,200 | $294,300 |
| 2021 | $4,998 | $365,600 | $107,200 | $258,400 |
| 2020 | $4,999 | $358,600 | $100,200 | $258,400 |
| 2019 | $3,190 | $321,900 | $95,600 | $226,300 |
| 2018 | $7,500 | $321,900 | $95,600 | $226,300 |
| 2017 | $4,037 | $313,100 | $95,600 | $217,500 |
| 2016 | $4,398 | $302,700 | $95,600 | $207,100 |
| 2015 | $4,323 | $302,700 | $95,600 | $207,100 |
Source: Public Records
Map
Nearby Homes
- 122 Truro St
- 81 Sylvia St
- 34 Chicopee St
- 14 Caswell St
- 11 Boylston St
- 65 Armsby St
- 15 Ball St
- 12 Hayes St Unit 1
- 14 Hayes St Unit 1
- 27 Meadow Ln
- 1940-1942 Acushnet Ave
- 29 Waldo St
- 209 Jarry St
- 1077 Shelburne St
- 91 S Main St
- 12 White St
- 868 Ashley Blvd
- 279 Adelaide St
- 23 Oliveira Ave
- 148 Princeton St
Your Personal Tour Guide
Ask me questions while you tour the home.