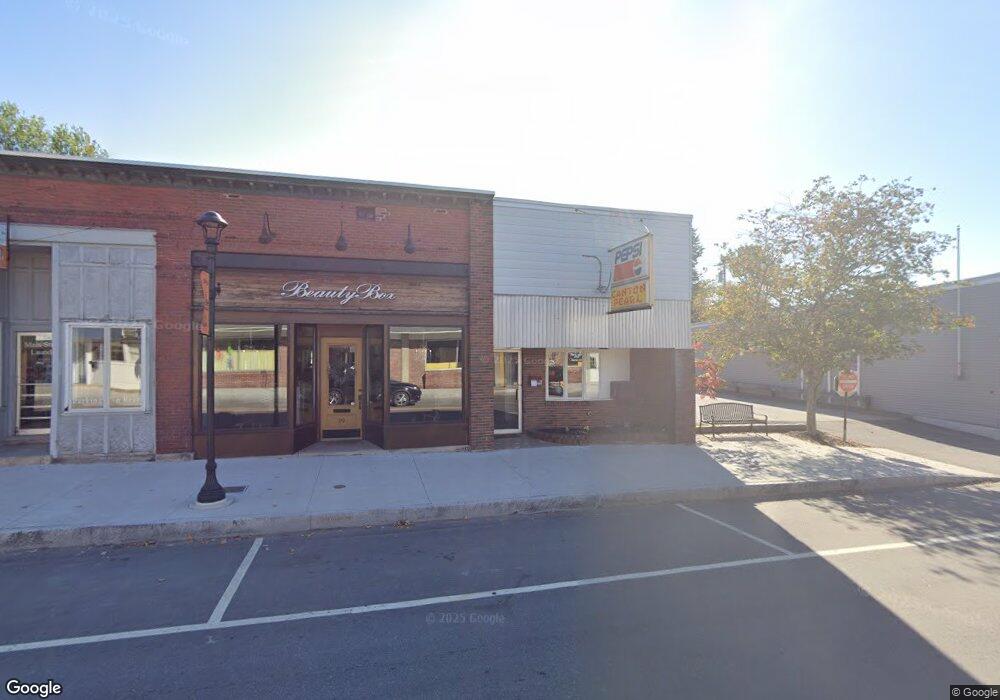
17 Main St Lisbon, ME 04252
Estimated Value: $176,400
Studio
--
Bath
1,260
Sq Ft
$140/Sq Ft
Est. Value
About This Home
This home is located at 17 Main St, Lisbon, ME 04252 and is currently priced at $176,400, approximately $140 per square foot. 17 Main St is a home located in Androscoggin County with nearby schools including Lisbon Community School, Philip W. Sugg Middle School, and Lisbon High School.
Ownership History
Date
Name
Owned For
Owner Type
Purchase Details
Closed on
Jul 24, 2009
Sold by
White Karl W
Bought by
Federal National Mortgage Association
Current Estimated Value
Purchase Details
Closed on
Feb 20, 2007
Sold by
Vierling Matthew D and Vierling Anna L
Bought by
White Karl W
Home Financials for this Owner
Home Financials are based on the most recent Mortgage that was taken out on this home.
Original Mortgage
$155,000
Interest Rate
6.24%
Mortgage Type
Commercial
Create a Home Valuation Report for This Property
The Home Valuation Report is an in-depth analysis detailing your home's value as well as a comparison with similar homes in the area
Home Values in the Area
Average Home Value in this Area
Purchase History
| Date | Buyer | Sale Price | Title Company |
|---|---|---|---|
| Federal National Mortgage Association | -- | -- | |
| White Karl W | -- | -- |
Source: Public Records
Mortgage History
| Date | Status | Borrower | Loan Amount |
|---|---|---|---|
| Previous Owner | White Karl W | $155,000 |
Source: Public Records
Tax History
| Year | Tax Paid | Tax Assessment Tax Assessment Total Assessment is a certain percentage of the fair market value that is determined by local assessors to be the total taxable value of land and additions on the property. | Land | Improvement |
|---|---|---|---|---|
| 2024 | $1,892 | $139,100 | $26,800 | $112,300 |
| 2023 | $1,749 | $82,900 | $18,500 | $64,400 |
| 2022 | $1,915 | $82,900 | $18,500 | $64,400 |
| 2021 | $1,832 | $82,900 | $18,500 | $64,400 |
| 2020 | $1,915 | $82,900 | $18,500 | $64,400 |
| 2019 | $1,915 | $82,900 | $18,500 | $64,400 |
| 2018 | $1,990 | $80,100 | $16,100 | $64,000 |
| 2017 | $1,858 | $80,100 | $16,100 | $64,000 |
| 2016 | $1,794 | $80,100 | $16,100 | $64,000 |
| 2015 | $1,970 | $83,500 | $30,400 | $53,100 |
| 2014 | $2,037 | $83,500 | $30,400 | $53,100 |
| 2013 | $1,921 | $83,500 | $30,400 | $53,100 |
Source: Public Records
Map
Nearby Homes
Your Personal Tour Guide
Ask me questions while you tour the home.