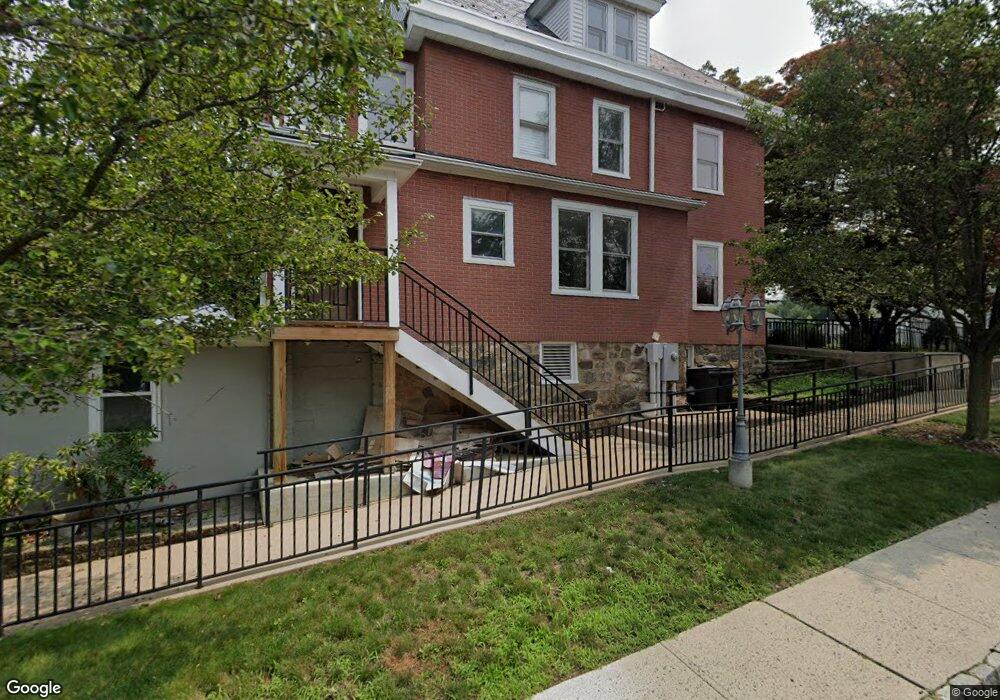
17 Main St Netcong, NJ 07857
Estimated Value: $832,781
--
Bed
--
Bath
4,188
Sq Ft
$199/Sq Ft
Est. Value
About This Home
This home is located at 17 Main St, Netcong, NJ 07857 and is currently estimated at $832,781, approximately $198 per square foot. 17 Main St is a home located in Morris County with nearby schools including Netcong Elementary School and Lenape Val Regional High School.
Ownership History
Date
Name
Owned For
Owner Type
Purchase Details
Closed on
Feb 20, 2025
Sold by
Kevland Properties Llc
Bought by
Creating Change Realty Management Llc
Current Estimated Value
Home Financials for this Owner
Home Financials are based on the most recent Mortgage that was taken out on this home.
Original Mortgage
$397,500
Interest Rate
6.65%
Mortgage Type
New Conventional
Purchase Details
Closed on
Oct 15, 2019
Sold by
Netcong Professional Center Llc
Bought by
Kevland Properties Llc
Home Financials for this Owner
Home Financials are based on the most recent Mortgage that was taken out on this home.
Original Mortgage
$307,500
Interest Rate
3.65%
Mortgage Type
Commercial
Purchase Details
Closed on
Dec 5, 2005
Sold by
Chapin Kellen M
Bought by
Netcong Professional Center Ll
Purchase Details
Closed on
Apr 26, 2001
Sold by
Semper Development
Bought by
Chapin Kellen
Home Financials for this Owner
Home Financials are based on the most recent Mortgage that was taken out on this home.
Original Mortgage
$150,000
Interest Rate
6.85%
Mortgage Type
Commercial
Create a Home Valuation Report for This Property
The Home Valuation Report is an in-depth analysis detailing your home's value as well as a comparison with similar homes in the area
Home Values in the Area
Average Home Value in this Area
Purchase History
| Date | Buyer | Sale Price | Title Company |
|---|---|---|---|
| Creating Change Realty Management Llc | $795,000 | Elite Title Group | |
| Kevland Properties Llc | $405,415 | None Available | |
| Netcong Professional Center Ll | -- | -- | |
| Chapin Kellen | $235,000 | -- |
Source: Public Records
Mortgage History
| Date | Status | Borrower | Loan Amount |
|---|---|---|---|
| Open | Creating Change Realty Management Llc | $318,000 | |
| Previous Owner | Creating Change Realty Management Llc | $397,500 | |
| Previous Owner | Kevland Properties Llc | $307,500 | |
| Previous Owner | Chapin Kellen | $150,000 |
Source: Public Records
Tax History Compared to Growth
Tax History
| Year | Tax Paid | Tax Assessment Tax Assessment Total Assessment is a certain percentage of the fair market value that is determined by local assessors to be the total taxable value of land and additions on the property. | Land | Improvement |
|---|---|---|---|---|
| 2025 | $16,908 | $479,400 | $142,200 | $337,200 |
| 2024 | $17,052 | $479,400 | $142,200 | $337,200 |
| 2023 | $17,052 | $479,400 | $142,200 | $337,200 |
| 2022 | $15,499 | $479,400 | $142,200 | $337,200 |
| 2021 | $15,499 | $479,400 | $142,200 | $337,200 |
| 2020 | $16,727 | $525,000 | $288,000 | $237,000 |
| 2019 | $15,950 | $525,000 | $288,000 | $237,000 |
| 2018 | $15,031 | $525,000 | $288,000 | $237,000 |
| 2017 | $19,514 | $708,300 | $288,000 | $420,300 |
| 2016 | $19,004 | $708,300 | $288,000 | $420,300 |
| 2015 | $18,338 | $708,300 | $288,000 | $420,300 |
| 2014 | $17,715 | $708,300 | $288,000 | $420,300 |
Source: Public Records
Map
Nearby Homes
- 21 Main St Unit 1
- 21 Main St
- 1 Jenny Lind Street 16 Unit 16
- 23 Main St
- 16 Main St
- 16 Main St Unit C
- 16 Main St Unit A-C
- 18 Main St
- 10 Main St
- 25 Main St
- 1 Jenny Lind St Unit 1 Unit 1
- 28 Main St Unit 30
- 8 Main St
- 1 Jenny Lind St 34 Unit 34
- 1 Jenny Lind St 10 Unit 10
- 1 Jenny Lind St Unit 29 Unit 29
- 1 Jenny Lind St 25 Unit 35
- 27 Main St
- 24 Main St
- 1 Jenny Lind St 27 Unit 27