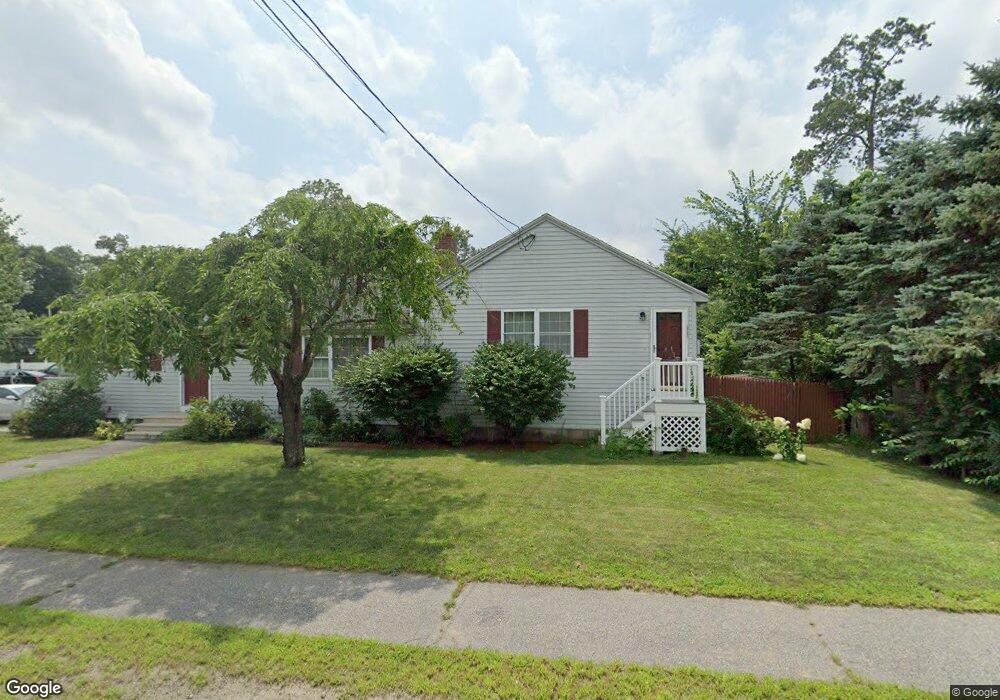
17 Main St Wilmington, MA 01887
Estimated Value: $732,440 - $849,000
4
Beds
3
Baths
1,835
Sq Ft
$425/Sq Ft
Est. Value
About This Home
This home is located at 17 Main St, Wilmington, MA 01887 and is currently estimated at $779,360, approximately $424 per square foot. 17 Main St is a home located in Middlesex County with nearby schools including Wilmington Middle School, Wilmington High School, and Abundant Life Christian School and Childcare.
Ownership History
Date
Name
Owned For
Owner Type
Purchase Details
Closed on
May 11, 2022
Sold by
29 Hawthorne Street Rt
Bought by
Duffy Elizabeth and Simpson Mark A
Current Estimated Value
Purchase Details
Closed on
Oct 31, 2007
Sold by
Simpson Joseph S
Bought by
29 Hawthorne Street Rt
Purchase Details
Closed on
Nov 15, 2004
Sold by
340 Rt
Bought by
Simpson Joseph and Simpson Mary E
Home Financials for this Owner
Home Financials are based on the most recent Mortgage that was taken out on this home.
Original Mortgage
$200,000
Interest Rate
5.75%
Mortgage Type
Purchase Money Mortgage
Purchase Details
Closed on
Nov 6, 2003
Sold by
Fisher John A and Fisher Margaret Anne
Bought by
340 Rt
Purchase Details
Closed on
Mar 2, 1990
Sold by
Ryder Arthur
Bought by
Fisher John A
Home Financials for this Owner
Home Financials are based on the most recent Mortgage that was taken out on this home.
Original Mortgage
$140,000
Interest Rate
9.78%
Mortgage Type
Purchase Money Mortgage
Create a Home Valuation Report for This Property
The Home Valuation Report is an in-depth analysis detailing your home's value as well as a comparison with similar homes in the area
Purchase History
| Date | Buyer | Sale Price | Title Company |
|---|---|---|---|
| Duffy Elizabeth | -- | None Available | |
| 29 Hawthorne Street Rt | -- | -- | |
| Simpson Joseph | $399,900 | -- | |
| 340 Rt | $180,000 | -- | |
| Fisher John A | $175,000 | -- |
Source: Public Records
Mortgage History
| Date | Status | Borrower | Loan Amount |
|---|---|---|---|
| Previous Owner | Simpson Joseph | $200,000 | |
| Previous Owner | Fisher John A | $126,500 | |
| Previous Owner | Fisher John A | $140,000 |
Source: Public Records
Tax History
| Year | Tax Paid | Tax Assessment Tax Assessment Total Assessment is a certain percentage of the fair market value that is determined by local assessors to be the total taxable value of land and additions on the property. | Land | Improvement |
|---|---|---|---|---|
| 2025 | $7,417 | $647,800 | $253,900 | $393,900 |
| 2024 | $7,010 | $613,300 | $253,900 | $359,400 |
| 2023 | $6,836 | $572,500 | $230,800 | $341,700 |
| 2022 | $6,565 | $503,800 | $192,400 | $311,400 |
| 2021 | $6,704 | $484,400 | $174,800 | $309,600 |
| 2020 | $6,508 | $479,200 | $174,800 | $304,400 |
| 2019 | $6,568 | $477,700 | $166,500 | $311,200 |
| 2018 | $5,660 | $422,200 | $158,600 | $263,600 |
| 2017 | $5,660 | $391,700 | $151,100 | $240,600 |
| 2016 | $5,409 | $369,700 | $143,900 | $225,800 |
| 2015 | $5,048 | $351,300 | $143,900 | $207,400 |
| 2014 | $4,847 | $340,400 | $137,000 | $203,400 |
Source: Public Records
Map
Nearby Homes
Your Personal Tour Guide
Ask me questions while you tour the home.