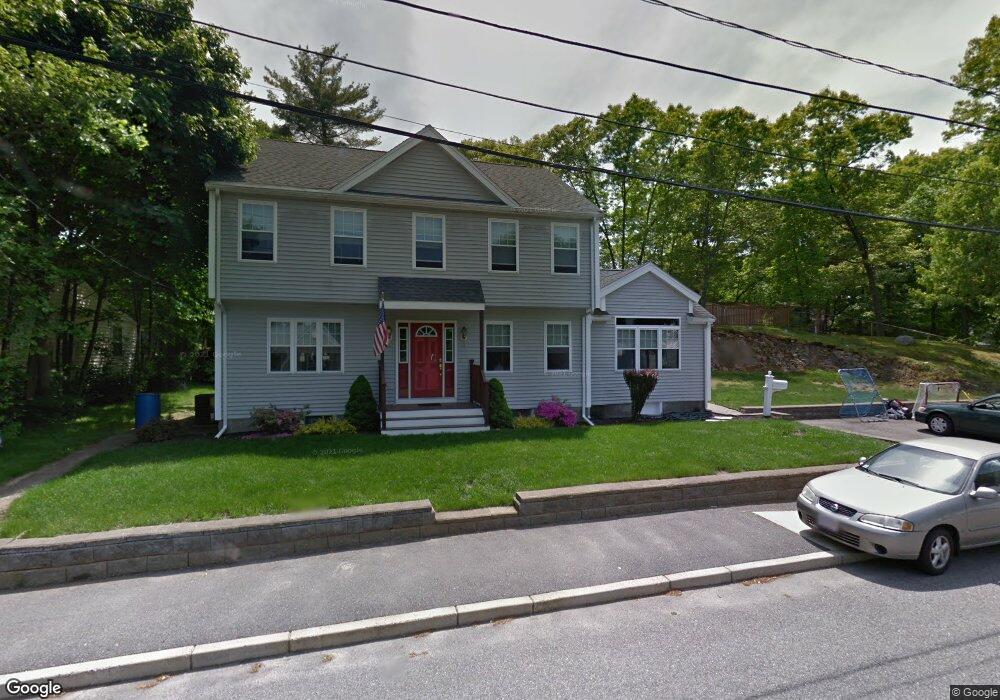
17 Mann St Braintree, MA 02184
Braintree Highlands NeighborhoodEstimated Value: $766,000 - $859,000
3
Beds
2
Baths
2,189
Sq Ft
$371/Sq Ft
Est. Value
About This Home
This home is located at 17 Mann St, Braintree, MA 02184 and is currently estimated at $812,362, approximately $371 per square foot. 17 Mann St is a home located in Norfolk County with nearby schools including Braintree High School, Boston Higashi School, and Lighthouse Baptist Christian Academy.
Ownership History
Date
Name
Owned For
Owner Type
Purchase Details
Closed on
Apr 28, 1994
Sold by
Riley Scott M and Riley Nina E
Bought by
Quigg Michael F and Quigg Mary A
Current Estimated Value
Purchase Details
Closed on
Jan 24, 1991
Sold by
Golbranson Carl E
Bought by
Riley Scott M and Riley Nina E
Create a Home Valuation Report for This Property
The Home Valuation Report is an in-depth analysis detailing your home's value as well as a comparison with similar homes in the area
Home Values in the Area
Average Home Value in this Area
Purchase History
| Date | Buyer | Sale Price | Title Company |
|---|---|---|---|
| Quigg Michael F | $145,000 | -- | |
| Quigg Michael F | $145,000 | -- | |
| Riley Scott M | $135,000 | -- | |
| Riley Scott M | $135,000 | -- |
Source: Public Records
Mortgage History
| Date | Status | Borrower | Loan Amount |
|---|---|---|---|
| Open | Riley Scott M | $146,097 | |
| Closed | Riley Scott M | $137,265 |
Source: Public Records
Tax History
| Year | Tax Paid | Tax Assessment Tax Assessment Total Assessment is a certain percentage of the fair market value that is determined by local assessors to be the total taxable value of land and additions on the property. | Land | Improvement |
|---|---|---|---|---|
| 2025 | $6,661 | $667,400 | $333,000 | $334,400 |
| 2024 | $5,901 | $622,500 | $302,300 | $320,200 |
| 2023 | $5,607 | $574,500 | $271,600 | $302,900 |
| 2022 | $5,456 | $548,300 | $245,400 | $302,900 |
| 2021 | $5,048 | $507,300 | $221,700 | $285,600 |
| 2020 | $4,803 | $487,100 | $201,500 | $285,600 |
| 2019 | $4,511 | $447,100 | $192,800 | $254,300 |
| 2018 | $4,419 | $419,300 | $175,300 | $244,000 |
| 2017 | $4,297 | $400,100 | $166,500 | $233,600 |
| 2016 | $4,145 | $377,500 | $157,700 | $219,800 |
| 2015 | $3,791 | $342,500 | $131,400 | $211,100 |
| 2014 | $3,675 | $321,800 | $126,200 | $195,600 |
Source: Public Records
Map
Nearby Homes
- 24 Evelyn Ln
- 1696 Liberty St
- 129 Albee Dr
- 38 Roosevelt St
- 1579 Washington St
- 15 Alida Rd
- 8 Dianthus Rd
- 1 Geraldine Ln
- 23 Portland Rd
- 55 Bradford Commons Ln Unit 55
- 278 N Franklin St
- 169 Tyson Commons Ln
- 365 Tilden Commons Ln Unit 365
- 123-125 N Franklin St
- 661 North St
- 220 Weymouth St
- 5 Clarendon Cir Unit Lot 4
- 43 Grove Cir
- 972 Liberty St
- 20 Isabelle Ave
Your Personal Tour Guide
Ask me questions while you tour the home.