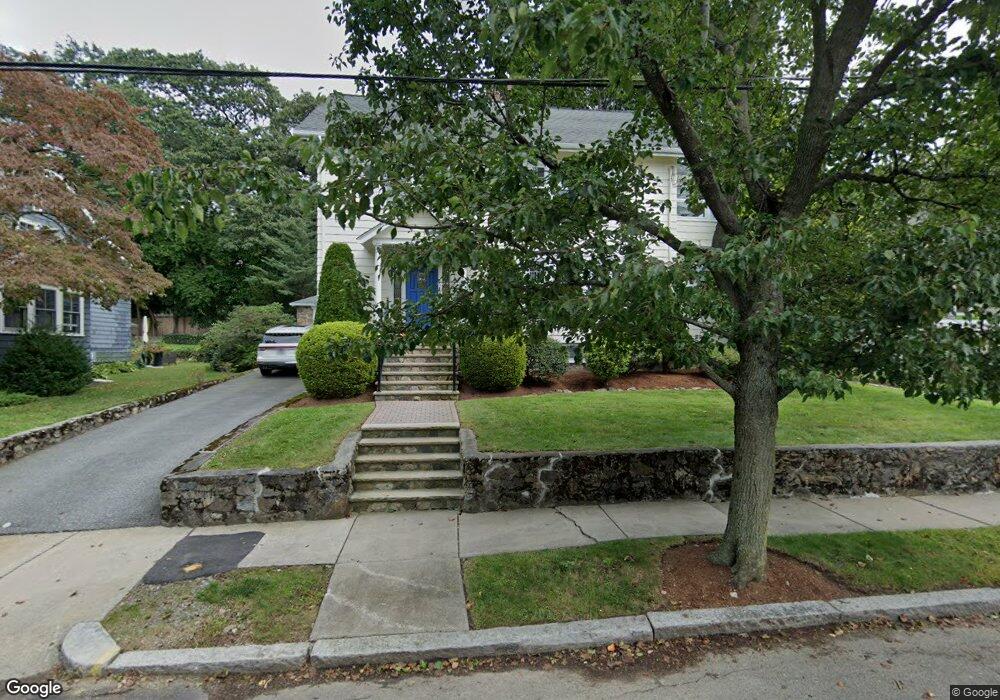
17 Maple Rd Melrose, MA 02176
Melrose Highlands NeighborhoodEstimated Value: $997,000 - $1,207,000
3
Beds
2
Baths
2,347
Sq Ft
$460/Sq Ft
Est. Value
About This Home
This home is located at 17 Maple Rd, Melrose, MA 02176 and is currently estimated at $1,078,581, approximately $459 per square foot. 17 Maple Rd is a home located in Middlesex County with nearby schools including Roosevelt Elementary School, Lincoln Elementary School, and Horace Mann Elementary School.
Ownership History
Date
Name
Owned For
Owner Type
Purchase Details
Closed on
Nov 14, 2017
Sold by
Wood Susan L and Tremblay Paul A
Bought by
Wood & Tremblay Ft
Current Estimated Value
Purchase Details
Closed on
May 26, 1992
Sold by
Wood Susan L and Woodlin Jeanne
Bought by
Wood Susan
Create a Home Valuation Report for This Property
The Home Valuation Report is an in-depth analysis detailing your home's value as well as a comparison with similar homes in the area
Home Values in the Area
Average Home Value in this Area
Purchase History
| Date | Buyer | Sale Price | Title Company |
|---|---|---|---|
| Wood & Tremblay Ft | -- | -- | |
| Wood Susan | $20,000 | -- |
Source: Public Records
Mortgage History
| Date | Status | Borrower | Loan Amount |
|---|---|---|---|
| Previous Owner | Wood Susan | $70,000 | |
| Previous Owner | Wood Susan | $170,000 | |
| Previous Owner | Wood Susan | $20,000 |
Source: Public Records
Tax History
| Year | Tax Paid | Tax Assessment Tax Assessment Total Assessment is a certain percentage of the fair market value that is determined by local assessors to be the total taxable value of land and additions on the property. | Land | Improvement |
|---|---|---|---|---|
| 2025 | $84 | $851,400 | $477,600 | $373,800 |
| 2024 | $8,318 | $837,700 | $463,900 | $373,800 |
| 2023 | $8,256 | $792,300 | $450,300 | $342,000 |
| 2022 | $7,810 | $738,900 | $409,400 | $329,500 |
| 2021 | $7,611 | $695,100 | $382,100 | $313,000 |
| 2020 | $7,682 | $695,200 | $382,100 | $313,100 |
| 2019 | $6,801 | $629,100 | $341,100 | $288,000 |
| 2018 | $6,587 | $581,400 | $293,400 | $288,000 |
| 2017 | $6,371 | $539,900 | $272,900 | $267,000 |
| 2016 | $6,354 | $515,300 | $272,900 | $242,400 |
| 2015 | $6,012 | $463,900 | $259,300 | $204,600 |
| 2014 | $5,798 | $436,600 | $232,000 | $204,600 |
Source: Public Records
Map
Nearby Homes
- 349 W Emerson St
- 53 Perkins St
- 132 Walton Park
- 601 Franklin St Unit 2
- 24 Ellsworth Ave
- 220 Essex St Unit 1
- 53 Melrose St Unit 4D
- 172 Florence St
- 300 Park Terrace Dr Unit 354
- 51 Melrose St Unit 4D
- 51 Melrose St Unit 1C
- 51 Melrose St Unit 1A
- 295 W Wyoming Ave Unit 10C
- 8 Crystal St Unit 2
- 8 Crystal St Unit 3
- 60 Franklin St Unit 60
- 58 Franklin St Unit 58
- 236-238 Main St
- 114-116 W Wyoming Ave Unit 1
- 33 Lake Ave