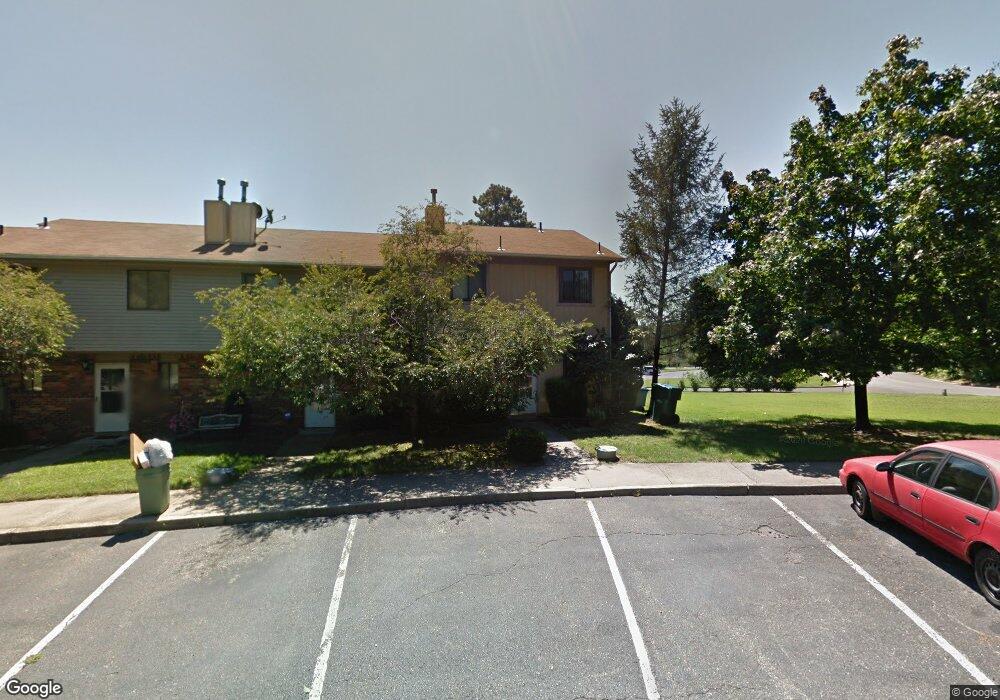
17 Max Place Howell, NJ 07731
Candlewood NeighborhoodEstimated Value: $330,000 - $380,000
2
Beds
2
Baths
1,276
Sq Ft
$278/Sq Ft
Est. Value
About This Home
This home is located at 17 Max Place, Howell, NJ 07731 and is currently estimated at $354,137, approximately $277 per square foot. 17 Max Place is a home located in Monmouth County with nearby schools including Taunton School, Aldrich School, and Howell Township Middle School South.
Ownership History
Date
Name
Owned For
Owner Type
Purchase Details
Closed on
Jul 26, 2018
Sold by
180 Turning Lives Around Inc
Bought by
Lundwll Christopher
Current Estimated Value
Home Financials for this Owner
Home Financials are based on the most recent Mortgage that was taken out on this home.
Original Mortgage
$124,800
Interest Rate
4.5%
Mortgage Type
New Conventional
Create a Home Valuation Report for This Property
The Home Valuation Report is an in-depth analysis detailing your home's value as well as a comparison with similar homes in the area
Home Values in the Area
Average Home Value in this Area
Purchase History
| Date | Buyer | Sale Price | Title Company |
|---|---|---|---|
| Lundwll Christopher | $156,000 | Fidelity National Title Insu |
Source: Public Records
Mortgage History
| Date | Status | Borrower | Loan Amount |
|---|---|---|---|
| Previous Owner | Lundwll Christopher | $124,800 |
Source: Public Records
Tax History Compared to Growth
Tax History
| Year | Tax Paid | Tax Assessment Tax Assessment Total Assessment is a certain percentage of the fair market value that is determined by local assessors to be the total taxable value of land and additions on the property. | Land | Improvement |
|---|---|---|---|---|
| 2025 | $5,278 | $339,200 | $200,000 | $139,200 |
| 2024 | $5,278 | $304,100 | $200,000 | $104,100 |
| 2023 | $5,278 | $283,600 | $182,000 | $101,600 |
| 2022 | $4,385 | $208,800 | $112,000 | $96,800 |
| 2021 | $4,385 | $191,100 | $105,000 | $86,100 |
| 2020 | $4,414 | $190,100 | $105,000 | $85,100 |
| 2019 | $3,984 | $168,400 | $84,800 | $83,600 |
| 2018 | $0 | $159,800 | $80,000 | $79,800 |
| 2017 | $0 | $147,300 | $70,000 | $77,300 |
| 2016 | $3,050 | $125,400 | $50,000 | $75,400 |
| 2015 | -- | $121,400 | $41,400 | $80,000 |
| 2014 | -- | $115,100 | $51,500 | $63,600 |
Source: Public Records
Map
Nearby Homes
- 13 Alec Dr
- 3 Canary Cir
- 16 Finch Rd
- 100 Solomon St
- 7 Cardinal Ln
- 10 Pepperridge Rd
- 40 S Westfield Rd
- 30 Forrest Hill Dr
- 111 S Durham Dr
- 107 S Durham Dr
- 45 Springhill Dr
- 20 N Longview Rd
- 409 Middle Ln
- 17 N Longview Rd
- 15 N Longview Rd
- 96 Heritage Dr
- 140 Locust Ave
- 215 Sunset Ln
- 224 Sunset Ln
- 24 Friendship Rd
- 17 Max Place Unit 1000
- 16 Max Place
- 18 Max Place
- 15 Max Place Unit 1000
- 14 Max Place
- 13 Max Place
- 13 Max Place Unit 1000
- 25 Livingston Dr
- 4 Jesse Rd
- 4 Jesse Rd Unit 1000
- 23 Livingston Dr
- 3 Jesse Rd
- 2 Jesse Rd
- 5 Jesse Rd Unit 5
- 1 Jesse Rd
- 6 Jesse Rd
- 6 Jesse Rd Unit 1000
- 29 Livingston Dr
- 21 Livingston Dr
- 12 Seagull Ln