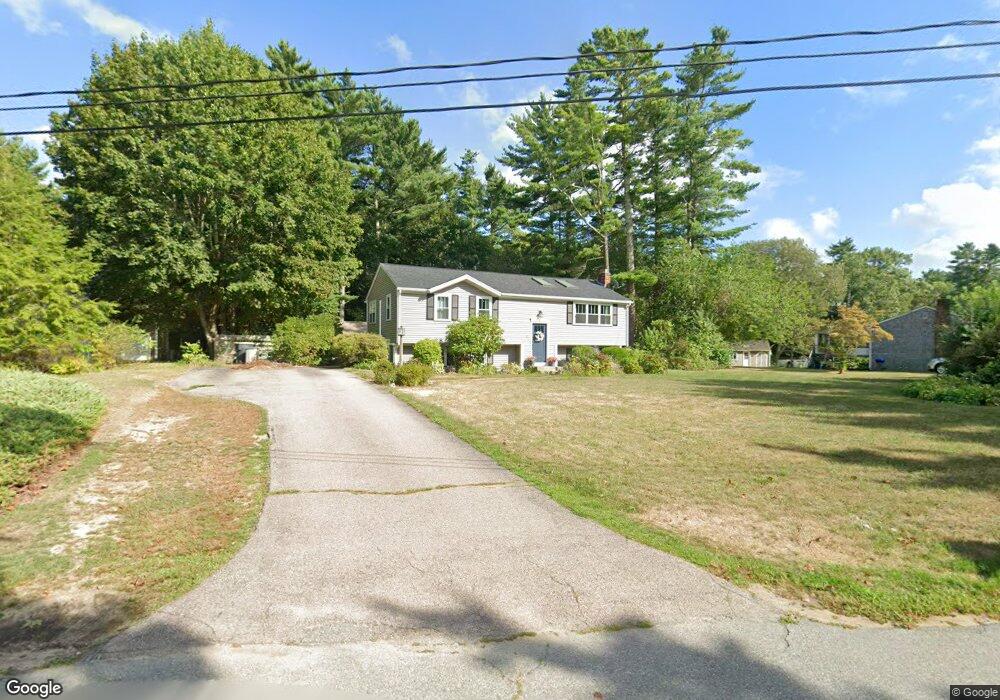
17 Mazzilli Dr Carver, MA 02330
Estimated Value: $571,000 - $728,000
3
Beds
2
Baths
2,024
Sq Ft
$313/Sq Ft
Est. Value
About This Home
This home is located at 17 Mazzilli Dr, Carver, MA 02330 and is currently estimated at $633,077, approximately $312 per square foot. 17 Mazzilli Dr is a home located in Plymouth County with nearby schools including Carver Elementary School and Carver Middle/High School.
Ownership History
Date
Name
Owned For
Owner Type
Purchase Details
Closed on
Jul 15, 2005
Sold by
Nichols Francis and Nichols Carol
Bought by
Prevett Mark S and Prevett Michelle P
Current Estimated Value
Home Financials for this Owner
Home Financials are based on the most recent Mortgage that was taken out on this home.
Original Mortgage
$327,250
Outstanding Balance
$170,939
Interest Rate
5.67%
Mortgage Type
Purchase Money Mortgage
Estimated Equity
$462,138
Create a Home Valuation Report for This Property
The Home Valuation Report is an in-depth analysis detailing your home's value as well as a comparison with similar homes in the area
Home Values in the Area
Average Home Value in this Area
Purchase History
| Date | Buyer | Sale Price | Title Company |
|---|---|---|---|
| Prevett Mark S | $385,000 | -- |
Source: Public Records
Mortgage History
| Date | Status | Borrower | Loan Amount |
|---|---|---|---|
| Open | Prevett Mark S | $30,000 | |
| Open | Prevett Mark S | $327,250 |
Source: Public Records
Tax History
| Year | Tax Paid | Tax Assessment Tax Assessment Total Assessment is a certain percentage of the fair market value that is determined by local assessors to be the total taxable value of land and additions on the property. | Land | Improvement |
|---|---|---|---|---|
| 2025 | $6,975 | $502,900 | $137,300 | $365,600 |
| 2024 | $6,878 | $485,400 | $134,600 | $350,800 |
| 2023 | $6,261 | $429,100 | $134,600 | $294,500 |
| 2022 | $5,905 | $369,500 | $115,100 | $254,400 |
| 2021 | $5,678 | $335,200 | $102,800 | $232,400 |
| 2020 | $5,406 | $314,500 | $96,000 | $218,500 |
| 2019 | $5,214 | $305,800 | $93,200 | $212,600 |
| 2018 | $5,016 | $284,500 | $93,200 | $191,300 |
| 2017 | $4,799 | $271,300 | $89,700 | $181,600 |
| 2016 | $4,298 | $252,400 | $85,400 | $167,000 |
| 2015 | $4,176 | $245,500 | $85,400 | $160,100 |
| 2014 | $4,125 | $242,500 | $108,000 | $134,500 |
Source: Public Records
Map
Nearby Homes
- 81 Center St
- 89 Silva St
- 35 Silva St
- 13 Pond View Way
- 56 Bunnys Rd
- 11 Brockton Ave
- 67 Crystal Lake Dr
- 43 S Meadow Rd
- 235 Main St
- 6 Twin Pines Ln Unit 6
- 7 Cedar Dr
- 48 S Meadow Village
- 29 S Meadow Village
- 55 S Meadow Village
- 6 Susan Cir
- 26 Santana Way Unit 26
- 1 Pinehurst Dr
- 40 Fosdick Rd
- 6 Coachman Terrace
- 6 Deer Hill Ln
Your Personal Tour Guide
Ask me questions while you tour the home.