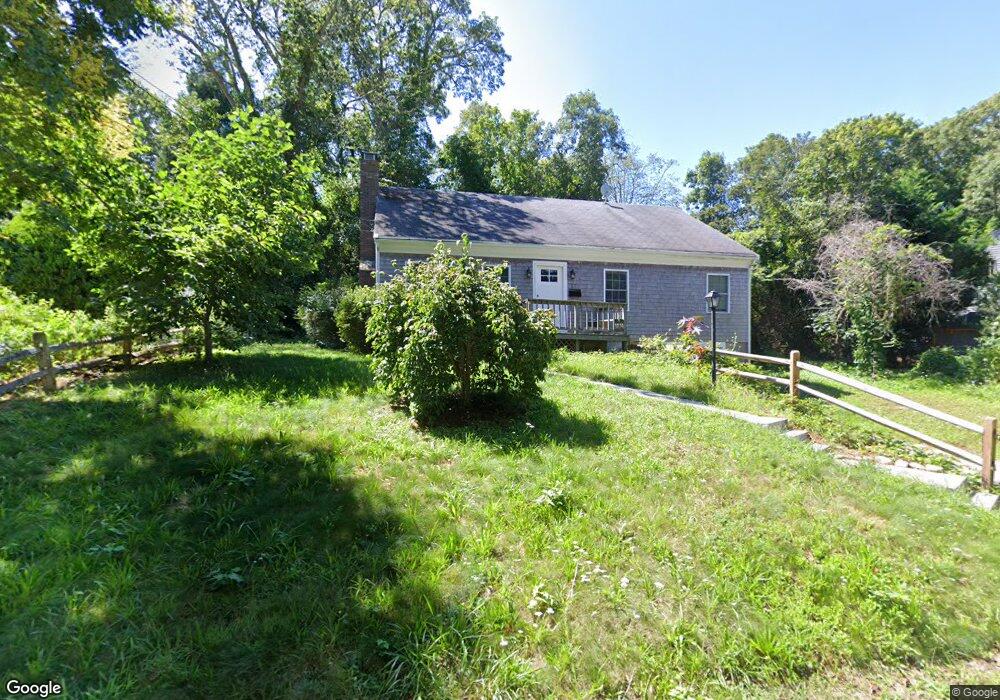
17 Mcgregor Rd Falmouth, MA 2543
Woods Hole NeighborhoodEstimated Value: $903,000 - $1,276,000
5
Beds
2
Baths
2,016
Sq Ft
$561/Sq Ft
Est. Value
About This Home
This home is located at 17 Mcgregor Rd, Falmouth, MA 2543 and is currently estimated at $1,131,861, approximately $561 per square foot. 17 Mcgregor Rd is a home located in Barnstable County with nearby schools including Mullen-Hall School, Lawrence School, and Morse Pond School.
Ownership History
Date
Name
Owned For
Owner Type
Purchase Details
Closed on
Jul 6, 2021
Sold by
17 Mcgregor Road Llc
Bought by
Schwarz Michael
Current Estimated Value
Purchase Details
Closed on
Dec 23, 2020
Sold by
Haber-Kornberg Donna
Bought by
17 Mcgregor Road Llc
Purchase Details
Closed on
Jul 27, 2006
Sold by
Halvorson Lisa Marie
Bought by
Kornberg Hans L and Kornberg Lisa Marie
Purchase Details
Closed on
Aug 27, 2002
Sold by
Griscom Sarah B
Bought by
Cannon Stephen C and Halvorson Lisa M
Home Financials for this Owner
Home Financials are based on the most recent Mortgage that was taken out on this home.
Original Mortgage
$348,000
Interest Rate
6.57%
Mortgage Type
Purchase Money Mortgage
Purchase Details
Closed on
Jun 19, 1989
Sold by
Thompson Sarah W
Bought by
Griscom Sarah B
Create a Home Valuation Report for This Property
The Home Valuation Report is an in-depth analysis detailing your home's value as well as a comparison with similar homes in the area
Home Values in the Area
Average Home Value in this Area
Purchase History
| Date | Buyer | Sale Price | Title Company |
|---|---|---|---|
| Schwarz Michael | $704,000 | None Available | |
| 17 Mcgregor Road Llc | -- | None Available | |
| Kornberg Hans L | $525,000 | -- | |
| Cannon Stephen C | $435,000 | -- | |
| Griscom Sarah B | $189,500 | -- |
Source: Public Records
Mortgage History
| Date | Status | Borrower | Loan Amount |
|---|---|---|---|
| Previous Owner | Griscom Sarah B | $352,299 | |
| Previous Owner | Griscom Sarah B | $348,000 | |
| Previous Owner | Griscom Sarah B | $30,000 | |
| Previous Owner | Griscom Sarah B | $89,800 |
Source: Public Records
Tax History Compared to Growth
Tax History
| Year | Tax Paid | Tax Assessment Tax Assessment Total Assessment is a certain percentage of the fair market value that is determined by local assessors to be the total taxable value of land and additions on the property. | Land | Improvement |
|---|---|---|---|---|
| 2025 | $5,212 | $887,900 | $412,800 | $475,100 |
| 2024 | $5,081 | $809,100 | $375,300 | $433,800 |
| 2023 | $4,667 | $674,400 | $300,300 | $374,100 |
| 2022 | $4,304 | $534,600 | $248,600 | $286,000 |
| 2021 | $3,929 | $462,200 | $237,800 | $224,400 |
| 2020 | $3,785 | $440,600 | $216,200 | $224,400 |
| 2019 | $3,605 | $421,200 | $216,200 | $205,000 |
| 2018 | $3,613 | $415,200 | $216,200 | $199,000 |
| 2017 | $3,479 | $407,800 | $216,200 | $191,600 |
| 2016 | $3,413 | $407,800 | $216,200 | $191,600 |
| 2015 | $3,340 | $407,800 | $216,200 | $191,600 |
| 2014 | $3,317 | $407,000 | $216,300 | $190,700 |
Source: Public Records
Map
Nearby Homes
- 29 Wilson Rd
- 9 Strawberry Hill Rd
- 9 Strawberry Hill Rd
- 76 F r Lillie Rd
- 533 Woods Hole Rd Unit B101
- 533 Woods Hole Rd Unit D101
- 533 Woods Hole Rd Unit B102
- 533 Woods Hole Rd Unit E202
- 533 Woods Hole Rd Unit E301
- 82 Harbor Hill Rd
- 10 Quissett Ave
- 54 Whitman Rd
- 14 School St
- 5 Park Rd
- 87 Oyster Pond Rd
- 251 Woods Hole Rd
- 44 Carey Ln
- 38 Landfall Unit 38
- 38 Landfall