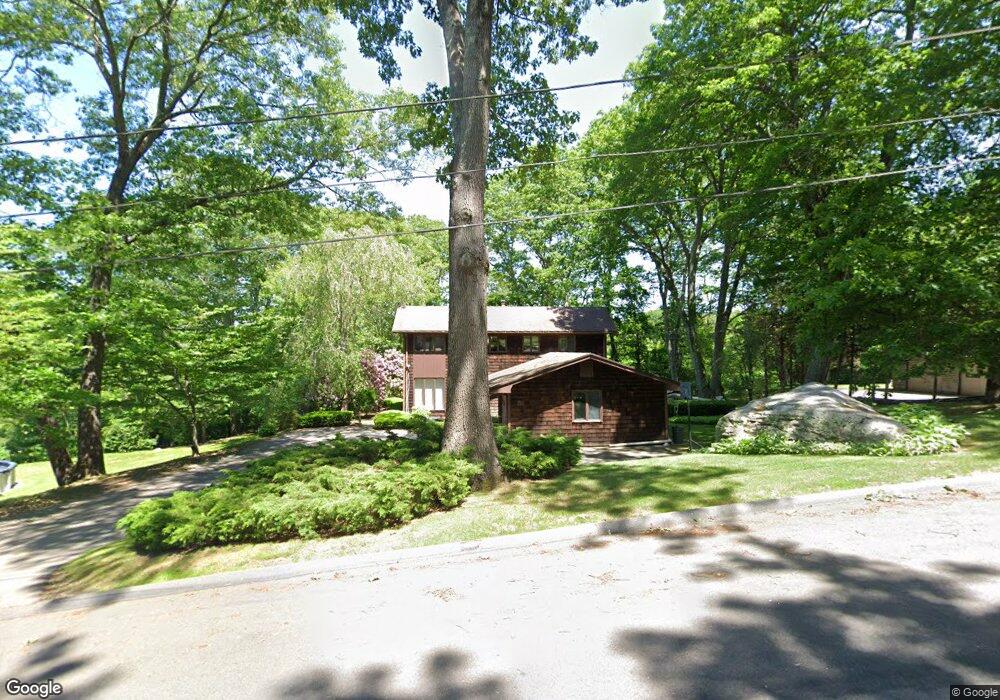
17 Midway Ave Westerly, RI 02891
Estimated Value: $718,000 - $818,000
5
Beds
5
Baths
3,063
Sq Ft
$256/Sq Ft
Est. Value
About This Home
This home is located at 17 Midway Ave, Westerly, RI 02891 and is currently estimated at $784,113, approximately $255 per square foot. 17 Midway Ave is a home located in Washington County with nearby schools including Westerly High School and St. Michael School.
Ownership History
Date
Name
Owned For
Owner Type
Purchase Details
Closed on
Sep 30, 2013
Sold by
Gulla Gregory M
Bought by
Blier Darren J and Blier Robin L
Current Estimated Value
Purchase Details
Closed on
Sep 16, 2011
Sold by
Gulla Sylvia M
Bought by
Sylvia M Gulla Irt
Create a Home Valuation Report for This Property
The Home Valuation Report is an in-depth analysis detailing your home's value as well as a comparison with similar homes in the area
Home Values in the Area
Average Home Value in this Area
Purchase History
| Date | Buyer | Sale Price | Title Company |
|---|---|---|---|
| Blier Darren J | $370,000 | -- | |
| Blier Darren J | $370,000 | -- | |
| Sylvia M Gulla Irt | -- | -- |
Source: Public Records
Mortgage History
| Date | Status | Borrower | Loan Amount |
|---|---|---|---|
| Previous Owner | Sylvia M Gulla Irt | $50,000 | |
| Previous Owner | Sylvia M Gulla Irt | $50,000 | |
| Previous Owner | Sylvia M Gulla Irt | $113,478 |
Source: Public Records
Tax History
| Year | Tax Paid | Tax Assessment Tax Assessment Total Assessment is a certain percentage of the fair market value that is determined by local assessors to be the total taxable value of land and additions on the property. | Land | Improvement |
|---|---|---|---|---|
| 2025 | $4,550 | $640,000 | $238,000 | $402,000 |
| 2024 | $4,240 | $432,200 | $170,400 | $261,800 |
| 2023 | $4,158 | $432,200 | $170,400 | $261,800 |
| 2022 | $4,132 | $432,200 | $170,400 | $261,800 |
| 2021 | $4,174 | $362,300 | $148,300 | $214,000 |
| 2020 | $4,098 | $362,300 | $148,300 | $214,000 |
| 2019 | $4,058 | $362,300 | $148,300 | $214,000 |
| 2018 | $4,251 | $357,800 | $148,300 | $209,500 |
| 2017 | $4,147 | $357,800 | $148,300 | $209,500 |
| 2016 | $4,179 | $357,800 | $148,300 | $209,500 |
| 2015 | $3,889 | $359,400 | $158,100 | $201,300 |
| 2014 | $3,824 | $359,400 | $158,100 | $201,300 |
Source: Public Records
Map
Nearby Homes
Your Personal Tour Guide
Ask me questions while you tour the home.