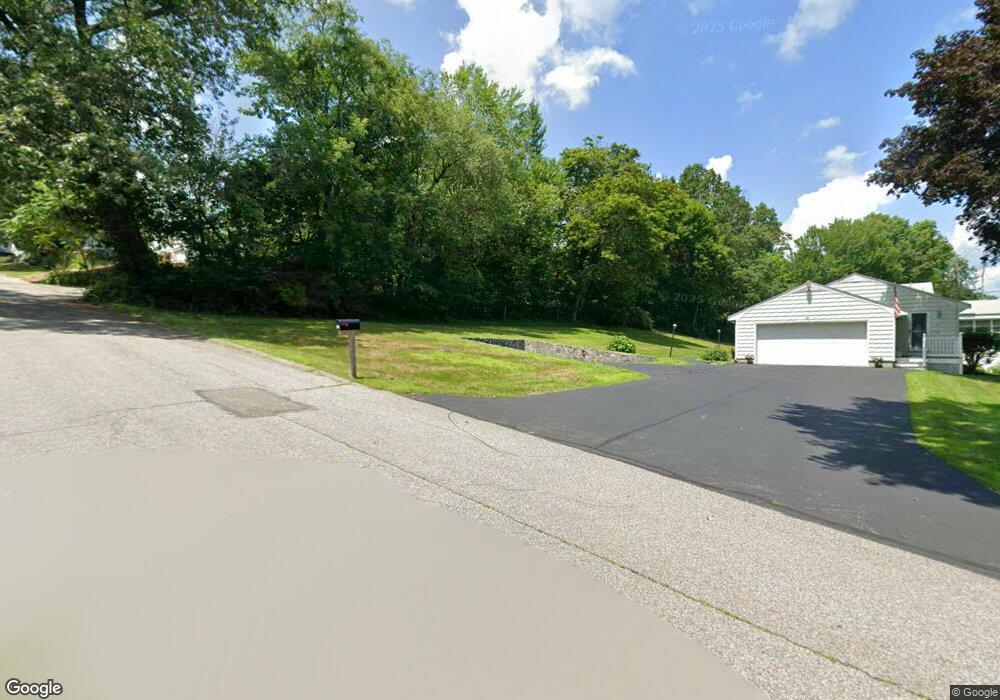
17 Milton St Dracut, MA 01826
Estimated Value: $584,000 - $705,000
2
Beds
3
Baths
1,870
Sq Ft
$342/Sq Ft
Est. Value
About This Home
This home is located at 17 Milton St, Dracut, MA 01826 and is currently estimated at $639,756, approximately $342 per square foot. 17 Milton St is a home located in Middlesex County with nearby schools including Joseph A. Campbell Elementary School, Richardson Middle School, and Dracut Senior High School.
Ownership History
Date
Name
Owned For
Owner Type
Purchase Details
Closed on
Sep 2, 2003
Sold by
Petruzziello Krista M and Payette Mary
Bought by
Payette Mary G and Payette Roger G
Current Estimated Value
Home Financials for this Owner
Home Financials are based on the most recent Mortgage that was taken out on this home.
Original Mortgage
$97,000
Outstanding Balance
$43,289
Interest Rate
5.69%
Estimated Equity
$596,467
Purchase Details
Closed on
Dec 15, 2000
Sold by
Ambrose Karl J
Bought by
Payette Roger G
Create a Home Valuation Report for This Property
The Home Valuation Report is an in-depth analysis detailing your home's value as well as a comparison with similar homes in the area
Home Values in the Area
Average Home Value in this Area
Purchase History
| Date | Buyer | Sale Price | Title Company |
|---|---|---|---|
| Payette Mary G | -- | -- | |
| Payette Roger G | $33,000 | -- |
Source: Public Records
Mortgage History
| Date | Status | Borrower | Loan Amount |
|---|---|---|---|
| Open | Payette Mary G | $97,000 | |
| Previous Owner | Payette Roger G | $100,000 | |
| Previous Owner | Payette Roger G | $80,000 | |
| Previous Owner | Payette Roger G | $189,600 |
Source: Public Records
Tax History
| Year | Tax Paid | Tax Assessment Tax Assessment Total Assessment is a certain percentage of the fair market value that is determined by local assessors to be the total taxable value of land and additions on the property. | Land | Improvement |
|---|---|---|---|---|
| 2025 | $6,575 | $649,700 | $207,800 | $441,900 |
| 2024 | $6,551 | $626,900 | $197,900 | $429,000 |
| 2023 | $6,304 | $544,400 | $172,100 | $372,300 |
| 2022 | $6,278 | $510,800 | $156,400 | $354,400 |
| 2021 | $5,713 | $470,700 | $142,100 | $328,600 |
| 2020 | $5,951 | $445,800 | $137,900 | $307,900 |
| 2019 | $13,838 | $422,400 | $131,200 | $291,200 |
| 2018 | $12,022 | $378,700 | $131,200 | $247,500 |
| 2017 | $5,148 | $378,700 | $131,200 | $247,500 |
| 2016 | $4,928 | $332,100 | $126,200 | $205,900 |
| 2015 | $4,782 | $320,300 | $126,200 | $194,100 |
| 2014 | $4,438 | $306,300 | $126,200 | $180,100 |
Source: Public Records
Map
Nearby Homes
- Lot 11 Christian St
- Lot 12 Christian St
- Lot 9 Christian St
- Lot 10 Christian St
- 100 Merrimack Ave Unit 9
- 81 Reservoir St
- Lots 1-12 Christian Hill Dev
- 164 Bradley St
- 89 Newbury St
- 52 Christian St
- 42 Christian St
- 11 Joseph Ave
- 4 Hazelwood Ave Unit 12
- 106 Methuen St Unit B
- 3 Vernon St
- 18 May St
- 105 3rd St
- 27-29 Fifth St
- 194 River Rd
- 35 Whitney Ave Unit 33
Your Personal Tour Guide
Ask me questions while you tour the home.