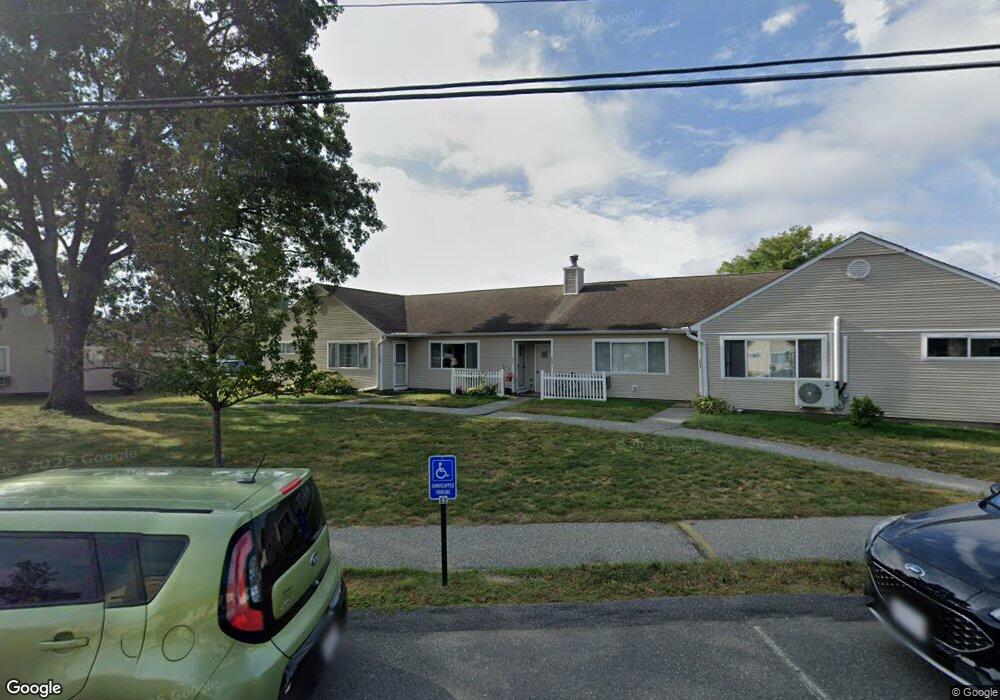
17 Mitchell Dr Unit R10 Chicopee, MA 01022
Fairview NeighborhoodEstimated Value: $214,000 - $239,000
2
Beds
1
Bath
850
Sq Ft
$265/Sq Ft
Est. Value
About This Home
This home is located at 17 Mitchell Dr Unit R10, Chicopee, MA 01022 and is currently estimated at $225,115, approximately $264 per square foot. 17 Mitchell Dr Unit R10 is a home located in Hampden County with nearby schools including Bowie Elementary School, Fairview Middle School, and Chicopee Comprehensive High School.
Ownership History
Date
Name
Owned For
Owner Type
Purchase Details
Closed on
Oct 31, 2019
Sold by
Rheaume Allan A
Bought by
Day Paulette S
Current Estimated Value
Home Financials for this Owner
Home Financials are based on the most recent Mortgage that was taken out on this home.
Original Mortgage
$68,940
Outstanding Balance
$60,649
Interest Rate
3.6%
Mortgage Type
New Conventional
Estimated Equity
$164,466
Purchase Details
Closed on
Aug 26, 1999
Sold by
Gingras Richard E and Gingras Barbara A
Bought by
Rheaume Allan A and Rheaume Dolores F
Home Financials for this Owner
Home Financials are based on the most recent Mortgage that was taken out on this home.
Original Mortgage
$63,050
Interest Rate
7.53%
Mortgage Type
Purchase Money Mortgage
Purchase Details
Closed on
Jul 30, 1993
Sold by
Westview Dev Assoc Lp
Bought by
Gingras Richard E and Gingras Barbara A
Create a Home Valuation Report for This Property
The Home Valuation Report is an in-depth analysis detailing your home's value as well as a comparison with similar homes in the area
Home Values in the Area
Average Home Value in this Area
Purchase History
| Date | Buyer | Sale Price | Title Company |
|---|---|---|---|
| Day Paulette S | $114,900 | -- | |
| Rheaume Allan A | $65,000 | -- | |
| Gingras Richard E | $76,990 | -- |
Source: Public Records
Mortgage History
| Date | Status | Borrower | Loan Amount |
|---|---|---|---|
| Open | Day Paulette S | $68,940 | |
| Previous Owner | Gingras Richard E | $63,050 |
Source: Public Records
Tax History
| Year | Tax Paid | Tax Assessment Tax Assessment Total Assessment is a certain percentage of the fair market value that is determined by local assessors to be the total taxable value of land and additions on the property. | Land | Improvement |
|---|---|---|---|---|
| 2025 | $2,785 | $183,700 | $0 | $183,700 |
| 2024 | $2,602 | $176,300 | $0 | $176,300 |
| 2023 | $2,447 | $161,500 | $0 | $161,500 |
| 2022 | $2,304 | $135,600 | $0 | $135,600 |
| 2021 | $2,055 | $116,700 | $0 | $116,700 |
| 2020 | $2,085 | $119,400 | $0 | $119,400 |
| 2019 | $2,053 | $114,300 | $0 | $114,300 |
| 2018 | $2,001 | $109,300 | $0 | $109,300 |
| 2017 | $1,693 | $97,800 | $0 | $97,800 |
| 2016 | $1,654 | $97,800 | $0 | $97,800 |
| 2015 | $1,715 | $97,800 | $0 | $97,800 |
| 2014 | $858 | $97,800 | $0 | $97,800 |
Source: Public Records
Map
Nearby Homes
- 117 Andersen Rd
- 1181 James St
- 76 Kelley Rd
- 240 Mccarthy Ave
- 104 Johnson Rd Unit 1103
- 104 Johnson Rd Unit 707
- 90 Anson St
- 156 Horseshoe Dr
- 144 Horseshoe Dr
- 81 Mccarthy Ave
- 143 Royal St
- 61 Saint Jacques Ave
- 58 Robinridge Rd
- 37 Greenwood Terrace
- 1709 Memorial Dr
- 128 Ann St
- 70 Greenwood Terrace
- 523 James St
- 18 Devlin Dr
- 72 Honeysuckle Dr
- 13 Mitchell Dr Unit 13
- 13 Mitchell Dr
- 17 Mitchell Dr
- 13 Mitchell Dr Unit 12
- 19 Mitchell Dr
- 107 Outer Dr
- 109 Outer Dr Unit 109
- 111 Outer Dr
- 109 Outer Dr
- 27 Mitchell Dr
- 21 Mitchell Dr
- 23 Mitchell Dr
- 22 Mitchell Dr
- 20 Mitchell Dr
- 18 Mitchell Dr
- 16 Mitchell Dr
- 20 Mitchell Dr Unit 20
- 18 Mitchell Dr Unit S2
- 123 Outer Dr
- 121 Outer Dr
Your Personal Tour Guide
Ask me questions while you tour the home.