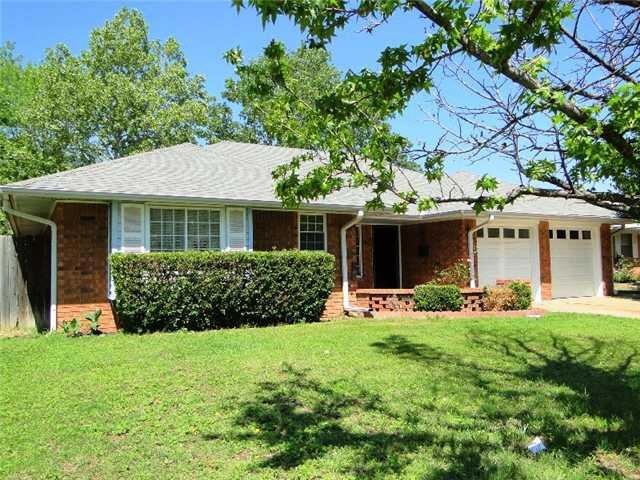

17 Mojave Dr Shawnee, OK 74801
Estimated payment $1,086/month
Highlights
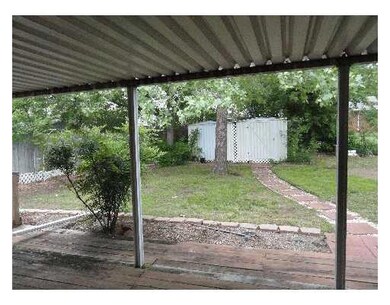
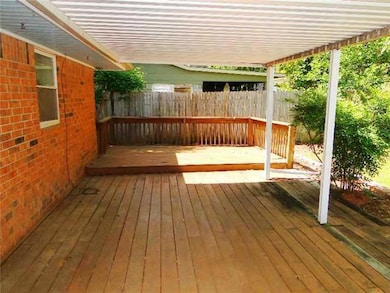
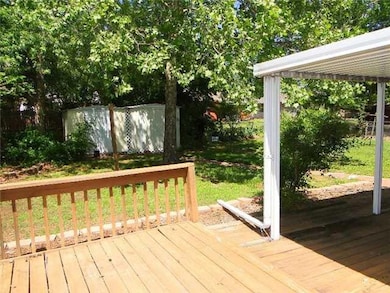
- Covered Deck
- Traditional Architecture
- Interior Lot
- Sequoyah Elementary School Rated 9+
- 2 Car Attached Garage
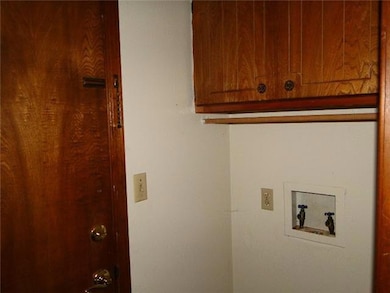
- Woodwork
About This Home
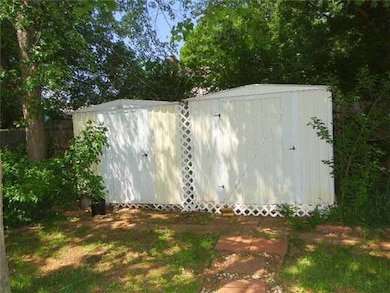
Beautiful open floor plan with family room/dining/kitchen as well as a formal living room/office. Three large bedrooms, two baths, gas fireplace, All kitchen appliances and large bar. The home has a large covered wood deck, privacy and chain link fencing, small storage building and garage door opener. Roof was installed in 2024. Home has been remodeled and is in overall good condition just ready for a family. Owner is willing to finance with at least 20% down.
Home Details
Home Type
- Single Family
Year Built
- Built in 1974
Lot Details
- 8,398 Sq Ft Lot
- Partially Fenced Property
- Chain Link Fence
- Interior Lot
Parking
- 2 Car Attached Garage
- Garage Door Opener
- Driveway
Home Design
- Traditional Architecture
- Brick Exterior Construction
- Slab Foundation
- Composition Roof
Interior Spaces
- 1,554 Sq Ft Home
- 1-Story Property
- Woodwork
- Fireplace Features Masonry
- Inside Utility
- Storm Doors
Kitchen
- Built-In Oven
- Electric Oven
- Built-In Range
- Dishwasher
- Disposal
Flooring
- Carpet
- Tile
Bedrooms and Bathrooms
- 3 Bedrooms
- 2 Full Bathrooms
Outdoor Features
- Covered Deck
- Outbuilding
Schools
- Sequoyah Elementary School
- Shawnee Middle School
- Shawnee High School
Utilities
- Central Heating and Cooling System
- Cable TV Available
Listing and Financial Details
- Legal Lot and Block 8 / 9
Map
Tax History
| Year | Tax Paid | Tax Assessment Tax Assessment Total Assessment is a certain percentage of the fair market value that is determined by local assessors to be the total taxable value of land and additions on the property. | Land | Improvement |
|---|---|---|---|---|
| 2025 | $1,460 | $14,883 | $1,176 | $13,707 |
| 2024 | $1,410 | $14,174 | $1,176 | $12,998 |
| 2023 | $1,410 | $13,500 | $1,176 | $12,324 |
| 2022 | $1,385 | $13,500 | $1,176 | $12,324 |
| 2021 | $1,360 | $13,500 | $1,176 | $12,324 |
| 2020 | $1,300 | $12,865 | $1,083 | $11,782 |
| 2019 | $1,279 | $12,252 | $1,014 | $11,238 |
| 2018 | $1,194 | $11,669 | $950 | $10,719 |
| 2017 | $1,122 | $11,114 | $883 | $10,231 |
| 2016 | $1,080 | $10,584 | $824 | $9,760 |
| 2015 | $1,008 | $10,080 | $803 | $9,277 |
| 2014 | $960 | $9,600 | $713 | $8,887 |
Property History
| Date | Event | Price | List to Sale | Price per Sq Ft |
|---|---|---|---|---|
| 10/16/2025 10/16/25 | Pending | -- | -- | -- |
| 09/25/2025 09/25/25 | For Sale | $179,000 | -- | $115 / Sq Ft |
Purchase History
| Date | Type | Sale Price | Title Company |
|---|---|---|---|
| Warranty Deed | $176,000 | Closed Llc | |
| Warranty Deed | $105,000 | First American Title | |
| Warranty Deed | -- | None Available | |
| Quit Claim Deed | -- | None Available | |
| Warranty Deed | $89,000 | -- | |
| Warranty Deed | $78,500 | -- | |
| Warranty Deed | $76,500 | -- |
Mortgage History
| Date | Status | Loan Amount | Loan Type |
|---|---|---|---|
| Previous Owner | $84,000 | Unknown |
Source: MLSOK
MLS Number: 1192997
APN: 159000009008000000
Disclaimer: Certain information contained herein is derived from information provided by parties other than Homes.com. All information provided is deemed reliable, but is not guaranteed to be accurate and should be independently verified.
![]() Based on information submitted to the MLS GRID. All data is obtained from various sources and may not have been verified by broker or MLS GRID. Supplied Open House Information is subject to change without notice. All information should be independently reviewed and verified for accuracy. Properties may or may not be listed by the office/agent presenting the information. Some IDX listings have been excluded from this website. IDX information is provided exclusively for personal, non-commercial use, and may not be used for any purpose other than to identify prospective properties consumers may be interested in purchasing.
Based on information submitted to the MLS GRID. All data is obtained from various sources and may not have been verified by broker or MLS GRID. Supplied Open House Information is subject to change without notice. All information should be independently reviewed and verified for accuracy. Properties may or may not be listed by the office/agent presenting the information. Some IDX listings have been excluded from this website. IDX information is provided exclusively for personal, non-commercial use, and may not be used for any purpose other than to identify prospective properties consumers may be interested in purchasing.
Information is deemed reliable but not guaranteed.
This information is not verified for authenticity or accuracy, is not guaranteed and may not reflect all real estate activity in the market.
Copyright 2026 MLSOK, Inc. All rights reserved.
Based on information submitted to the MLS GRID
- 19 Cheyenne Dr
- 7 Kiowa
- 5 Larkins Place
- 17 Sequoyah Blvd
- 32 Comanche Dr
- 30 Seneca Dr
- 1233 Sherry Ln
- 1307 Laverne Ave
- 1262 Augusta Ct
- 1181 Augusta Ct
- 1301 Rickey Rd
- 1404 Charles Dr
- 9 Dustin Cir
- 1725 E Dougherty Dr
- 1202 Mark St
- 1306 E Wallace St
- 648 N Cleveland Ave
- 542 Lakeside Ct
- 2310 Lakeside Cir
- 1836 N Bryan Ave

Ask me questions while you tour the home.