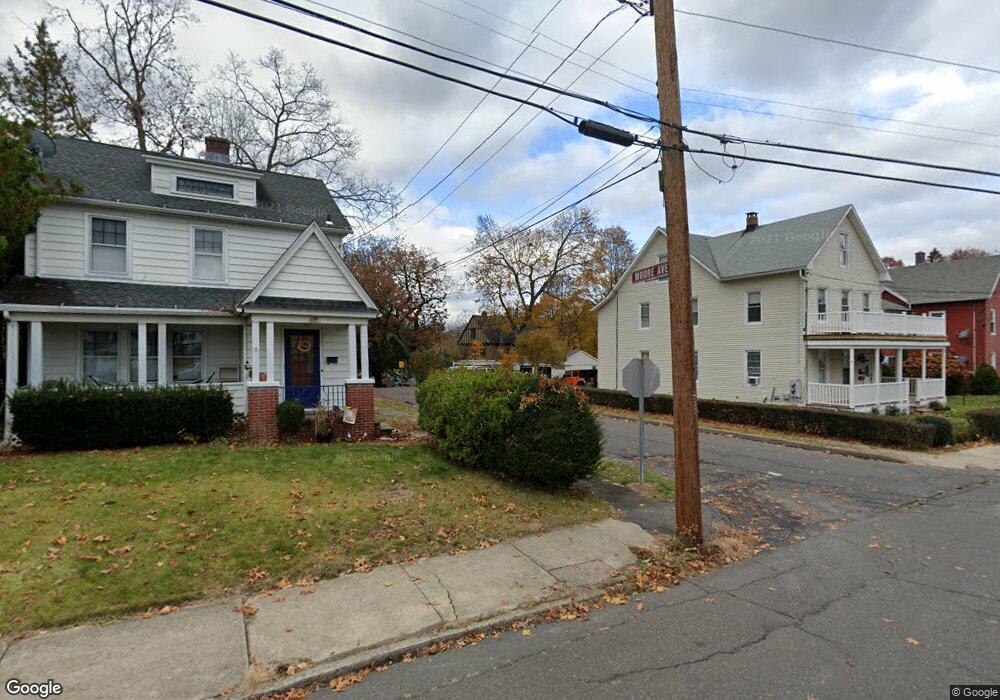
17 Moore Ave Naugatuck, CT 06770
Estimated Value: $334,000 - $461,000
4
Beds
2
Baths
2,507
Sq Ft
$161/Sq Ft
Est. Value
About This Home
This home is located at 17 Moore Ave, Naugatuck, CT 06770 and is currently estimated at $403,474, approximately $160 per square foot. 17 Moore Ave is a home located in New Haven County with nearby schools including City Hill Middle School and Naugatuck High School.
Ownership History
Date
Name
Owned For
Owner Type
Purchase Details
Closed on
Jul 18, 1988
Sold by
Prifty Robert
Bought by
Dunn David
Current Estimated Value
Home Financials for this Owner
Home Financials are based on the most recent Mortgage that was taken out on this home.
Original Mortgage
$156,000
Interest Rate
10.57%
Mortgage Type
Purchase Money Mortgage
Create a Home Valuation Report for This Property
The Home Valuation Report is an in-depth analysis detailing your home's value as well as a comparison with similar homes in the area
Home Values in the Area
Average Home Value in this Area
Purchase History
| Date | Buyer | Sale Price | Title Company |
|---|---|---|---|
| Dunn David | $195,000 | -- |
Source: Public Records
Mortgage History
| Date | Status | Borrower | Loan Amount |
|---|---|---|---|
| Open | Dunn David | $50,000 | |
| Closed | Dunn David | $10,000 | |
| Closed | Dunn David | $150,000 | |
| Closed | Dunn David | $156,000 |
Source: Public Records
Tax History
| Year | Tax Paid | Tax Assessment Tax Assessment Total Assessment is a certain percentage of the fair market value that is determined by local assessors to be the total taxable value of land and additions on the property. | Land | Improvement |
|---|---|---|---|---|
| 2025 | $8,492 | $213,430 | $31,920 | $181,510 |
| 2024 | $8,919 | $213,430 | $31,920 | $181,510 |
| 2023 | $9,551 | $213,430 | $31,920 | $181,510 |
| 2022 | $7,309 | $153,070 | $34,270 | $118,800 |
| 2021 | $7,309 | $153,070 | $34,270 | $118,800 |
| 2020 | $7,309 | $153,070 | $34,270 | $118,800 |
| 2019 | $7,233 | $153,070 | $34,270 | $118,800 |
| 2018 | $6,147 | $127,130 | $41,240 | $85,890 |
| 2017 | $6,172 | $127,130 | $41,240 | $85,890 |
| 2016 | $6,060 | $127,130 | $41,240 | $85,890 |
| 2015 | $5,793 | $127,130 | $41,240 | $85,890 |
| 2014 | $5,728 | $127,130 | $41,240 | $85,890 |
| 2012 | $7,014 | $209,060 | $52,070 | $156,990 |
Source: Public Records
Map
Nearby Homes
- 80 Cliff St
- 15 Summit Rd
- 150 Millville Ave
- 150 Scott St
- 41 Millville Ave Unit 201
- 22 Lewis St
- 470 Rubber Ave
- 89 N Hoadley St
- 3 Maple Terrace
- 80 Olive St
- 23 Salem St
- 0 Andrew Mountain Rd Unit 170603648
- 167 N Hoadley St
- 79 Ward St
- 51 Joseph Rd
- 80 Ward St
- 4 Culver Ct
- 18 Bridge St Unit 1O
- 92 Birch Ln
- 231 N Main St
Your Personal Tour Guide
Ask me questions while you tour the home.