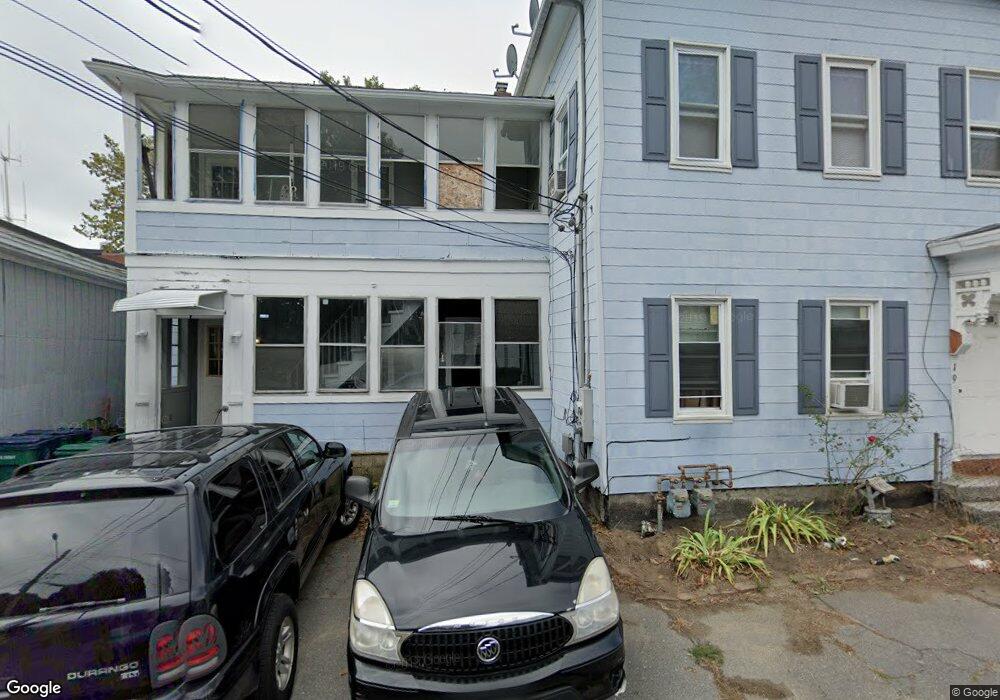
17 Morris St Unit 19 Fitchburg, MA 01420
North of Main NeighborhoodEstimated Value: $297,000 - $480,000
6
Beds
2
Baths
2,388
Sq Ft
$170/Sq Ft
Est. Value
About This Home
This home is located at 17 Morris St Unit 19, Fitchburg, MA 01420 and is currently estimated at $405,215, approximately $169 per square foot. 17 Morris St Unit 19 is a home located in Worcester County with nearby schools including South Street Elementary School, Crocker Elementary School, and Reingold Elementary School.
Ownership History
Date
Name
Owned For
Owner Type
Purchase Details
Closed on
Feb 2, 2006
Sold by
Flagg Patricia A
Bought by
Flagg Donald M
Current Estimated Value
Home Financials for this Owner
Home Financials are based on the most recent Mortgage that was taken out on this home.
Original Mortgage
$100,000
Outstanding Balance
$56,662
Interest Rate
6.31%
Mortgage Type
Purchase Money Mortgage
Estimated Equity
$348,553
Purchase Details
Closed on
Mar 26, 1998
Sold by
Cotnoir Jane L
Bought by
Flagg Patricia A
Home Financials for this Owner
Home Financials are based on the most recent Mortgage that was taken out on this home.
Original Mortgage
$62,695
Interest Rate
6.96%
Mortgage Type
Purchase Money Mortgage
Create a Home Valuation Report for This Property
The Home Valuation Report is an in-depth analysis detailing your home's value as well as a comparison with similar homes in the area
Home Values in the Area
Average Home Value in this Area
Purchase History
| Date | Buyer | Sale Price | Title Company |
|---|---|---|---|
| Flagg Donald M | $185,000 | -- | |
| Flagg Patricia A | $62,000 | -- |
Source: Public Records
Mortgage History
| Date | Status | Borrower | Loan Amount |
|---|---|---|---|
| Open | Flagg Donald M | $100,000 | |
| Previous Owner | Flagg Patricia A | $62,695 |
Source: Public Records
Tax History Compared to Growth
Tax History
| Year | Tax Paid | Tax Assessment Tax Assessment Total Assessment is a certain percentage of the fair market value that is determined by local assessors to be the total taxable value of land and additions on the property. | Land | Improvement |
|---|---|---|---|---|
| 2025 | $45 | $330,100 | $56,200 | $273,900 |
| 2024 | $4,117 | $278,000 | $33,700 | $244,300 |
| 2023 | $3,906 | $243,800 | $25,900 | $217,900 |
| 2022 | $3,603 | $204,600 | $22,700 | $181,900 |
| 2021 | $3,229 | $169,700 | $17,200 | $152,500 |
| 2020 | $2,996 | $152,000 | $14,100 | $137,900 |
| 2019 | $2,703 | $131,900 | $19,600 | $112,300 |
| 2018 | $2,532 | $120,500 | $18,000 | $102,500 |
| 2017 | $2,289 | $106,500 | $16,500 | $90,000 |
| 2016 | $2,044 | $96,300 | $16,500 | $79,800 |
| 2015 | $1,960 | $94,800 | $17,200 | $77,600 |
| 2014 | $1,880 | $94,800 | $17,200 | $77,600 |
Source: Public Records
Map
Nearby Homes
- 17-19 Morris St
- 15 Morris St
- 13 Morris St
- 31 Willow St
- 18 Morris St
- 14 Morris St
- 41 Willow St
- 11 Morris St
- 24 Morris St
- 43 Willow St Unit 1
- 43 Willow St Unit 2
- 43 Willow St
- 49 Myrtle Ave
- 43-45 Myrtle Ave
- 28 Morris St
- 43 Myrtle Ave Unit 45
- 39 Myrtle Ave Unit 41
- 39-41 Myrtle Ave Unit 1
- 39-41 Myrtle Ave Unit 3
- 39-41 Myrtle Ave Unit 2