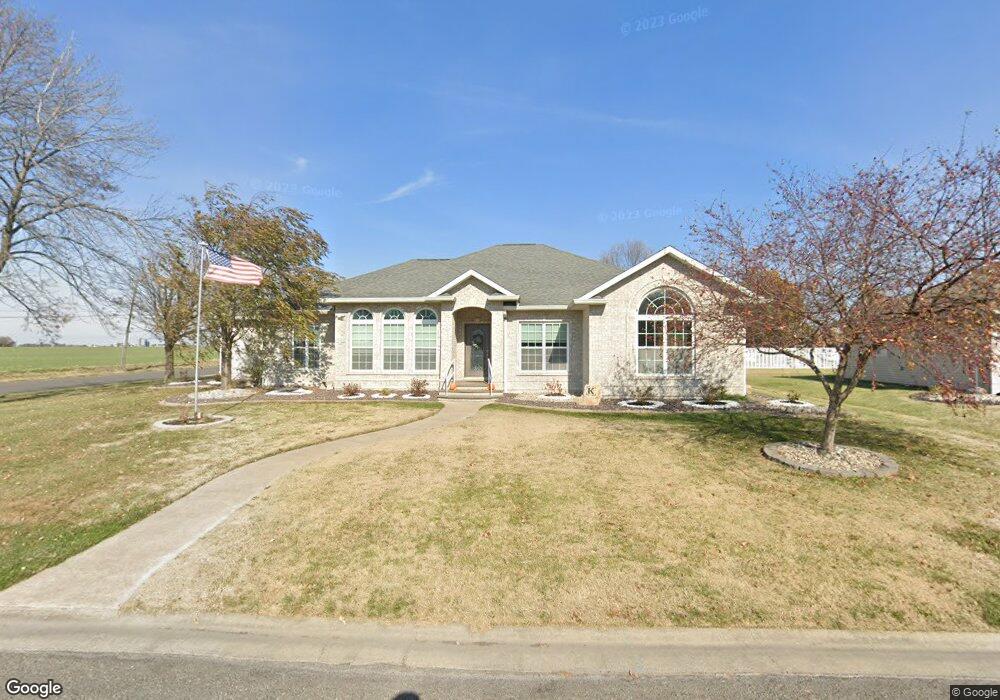
17 N 8th St Breese, IL 62230
Estimated Value: $374,000 - $424,000
3
Beds
4
Baths
2,597
Sq Ft
$156/Sq Ft
Est. Value
About This Home
This home is located at 17 N 8th St, Breese, IL 62230 and is currently estimated at $404,110, approximately $155 per square foot. 17 N 8th St is a home located in Clinton County with nearby schools including Breese ESD #12, Beckemeyer Elementary School, and Central Community High School.
Ownership History
Date
Name
Owned For
Owner Type
Purchase Details
Closed on
Jul 26, 2021
Sold by
Klostermann Leann K and Klostermann Robert J
Bought by
Klostermann Leann K
Current Estimated Value
Purchase Details
Closed on
Jul 13, 2009
Sold by
Mater Dei High School
Bought by
Klostermann Leann K and Robert J Klostermann Family Tr
Home Financials for this Owner
Home Financials are based on the most recent Mortgage that was taken out on this home.
Original Mortgage
$286,500
Outstanding Balance
$189,912
Interest Rate
5.62%
Mortgage Type
Future Advance Clause Open End Mortgage
Estimated Equity
$214,198
Create a Home Valuation Report for This Property
The Home Valuation Report is an in-depth analysis detailing your home's value as well as a comparison with similar homes in the area
Home Values in the Area
Average Home Value in this Area
Purchase History
| Date | Buyer | Sale Price | Title Company |
|---|---|---|---|
| Klostermann Leann K | -- | None Available | |
| Klostermann Leann K | -- | None Available |
Source: Public Records
Mortgage History
| Date | Status | Borrower | Loan Amount |
|---|---|---|---|
| Open | Klostermann Leann K | $286,500 |
Source: Public Records
Tax History
| Year | Tax Paid | Tax Assessment Tax Assessment Total Assessment is a certain percentage of the fair market value that is determined by local assessors to be the total taxable value of land and additions on the property. | Land | Improvement |
|---|---|---|---|---|
| 2024 | $5,684 | $132,700 | $16,310 | $116,390 |
| 2023 | $5,684 | $125,190 | $15,390 | $109,800 |
| 2022 | $6,031 | $113,810 | $13,990 | $99,820 |
| 2021 | $7,461 | $108,390 | $13,320 | $95,070 |
| 2020 | $6,637 | $104,220 | $12,810 | $91,410 |
| 2019 | $6,704 | $104,220 | $12,810 | $91,410 |
| 2018 | $6,889 | $99,559 | $11,960 | $87,599 |
| 2017 | $6,995 | $95,730 | $11,500 | $84,230 |
| 2016 | $6,938 | $95,730 | $11,500 | $84,230 |
| 2015 | $6,408 | $95,980 | $11,500 | $84,480 |
| 2013 | $6,408 | $100,970 | $11,500 | $89,470 |
Source: Public Records
Map
Nearby Homes
Your Personal Tour Guide
Ask me questions while you tour the home.