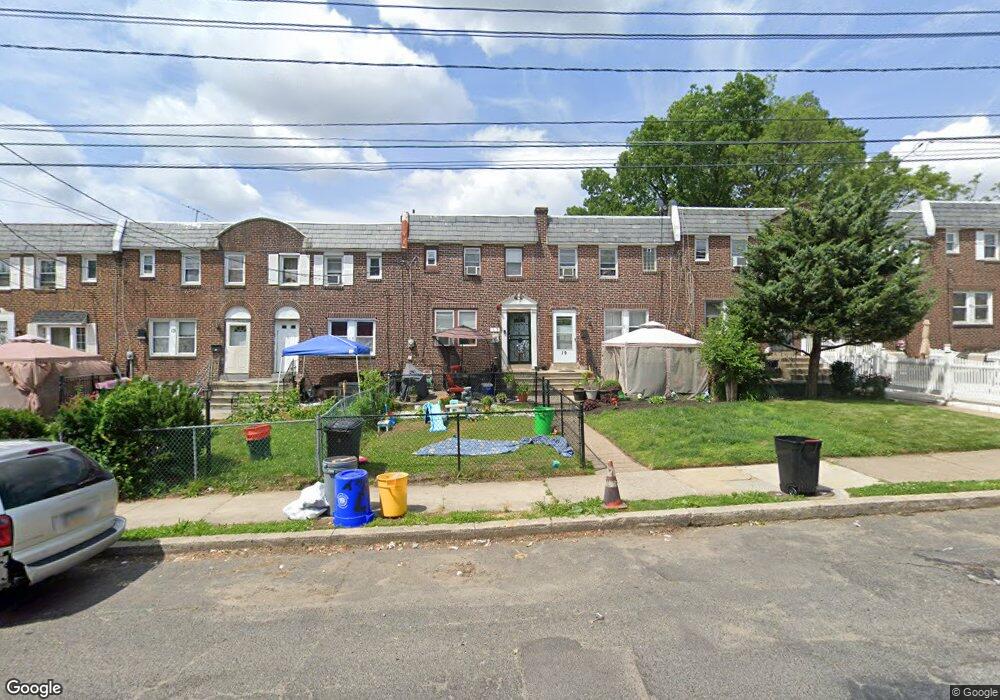
17 N Dudley St Camden, NJ 08105
Dudley NeighborhoodEstimated Value: $113,475 - $199,000
--
Bed
--
Bath
1,080
Sq Ft
$156/Sq Ft
Est. Value
About This Home
This home is located at 17 N Dudley St, Camden, NJ 08105 and is currently estimated at $168,619, approximately $156 per square foot. 17 N Dudley St is a home located in Camden County with nearby schools including Eastside High School, St Joseph Pro-Cathedral School, and Camden Forward School.
Ownership History
Date
Name
Owned For
Owner Type
Purchase Details
Closed on
Dec 18, 2018
Sold by
Mitchell El Bernard and Estate Of Cheryl Bey
Bought by
Mitchell El Bernard and El Naeema
Current Estimated Value
Purchase Details
Closed on
Apr 13, 2000
Sold by
St Joseph'S Carpenter Society
Bought by
Bey Cheryl
Home Financials for this Owner
Home Financials are based on the most recent Mortgage that was taken out on this home.
Original Mortgage
$40,740
Outstanding Balance
$13,937
Interest Rate
8.21%
Estimated Equity
$154,682
Purchase Details
Closed on
Mar 6, 1997
Sold by
Federal Housing Administration
Bought by
St Joseph'S Carpenter Society
Create a Home Valuation Report for This Property
The Home Valuation Report is an in-depth analysis detailing your home's value as well as a comparison with similar homes in the area
Home Values in the Area
Average Home Value in this Area
Purchase History
| Date | Buyer | Sale Price | Title Company |
|---|---|---|---|
| Mitchell El Bernard | -- | None Available | |
| Bey Cheryl | $42,000 | -- | |
| St Joseph'S Carpenter Society | $16,000 | -- |
Source: Public Records
Mortgage History
| Date | Status | Borrower | Loan Amount |
|---|---|---|---|
| Open | Bey Cheryl | $40,740 |
Source: Public Records
Tax History Compared to Growth
Tax History
| Year | Tax Paid | Tax Assessment Tax Assessment Total Assessment is a certain percentage of the fair market value that is determined by local assessors to be the total taxable value of land and additions on the property. | Land | Improvement |
|---|---|---|---|---|
| 2025 | $2,186 | $61,700 | $18,400 | $43,300 |
| 2024 | $2,113 | $61,700 | $18,400 | $43,300 |
| 2023 | $2,113 | $61,700 | $18,400 | $43,300 |
| 2022 | $2,074 | $61,700 | $18,400 | $43,300 |
| 2021 | $2,066 | $61,700 | $18,400 | $43,300 |
| 2020 | $1,962 | $61,700 | $18,400 | $43,300 |
| 2019 | $1,879 | $61,700 | $18,400 | $43,300 |
| 2018 | $1,869 | $61,700 | $18,400 | $43,300 |
| 2017 | $1,823 | $61,700 | $18,400 | $43,300 |
| 2016 | $1,765 | $61,700 | $18,400 | $43,300 |
| 2015 | $1,699 | $61,700 | $18,400 | $43,300 |
| 2014 | $1,659 | $61,700 | $18,400 | $43,300 |
Source: Public Records
Map
Nearby Homes
- 2937 Carman St
- 3075 Stevens St
- 2934 Cramer St
- 2817 Westfield Ave
- 3170 Merriel Ave
- 100 E 28th St
- 113 S 32nd St
- 3027 Morrison St
- 2709 Westfield Ave
- 154 Eutaw Ave
- 2707 Westfield Ave
- 127 N 33rd St
- 226 Wilmot Ave
- 2598 Baird Blvd
- 363 Garden Ave
- 2933 Royden St
- 3001 Royden St
- 224 S 32nd St
- 402 S 30th St
- 2621 Westfield Ave