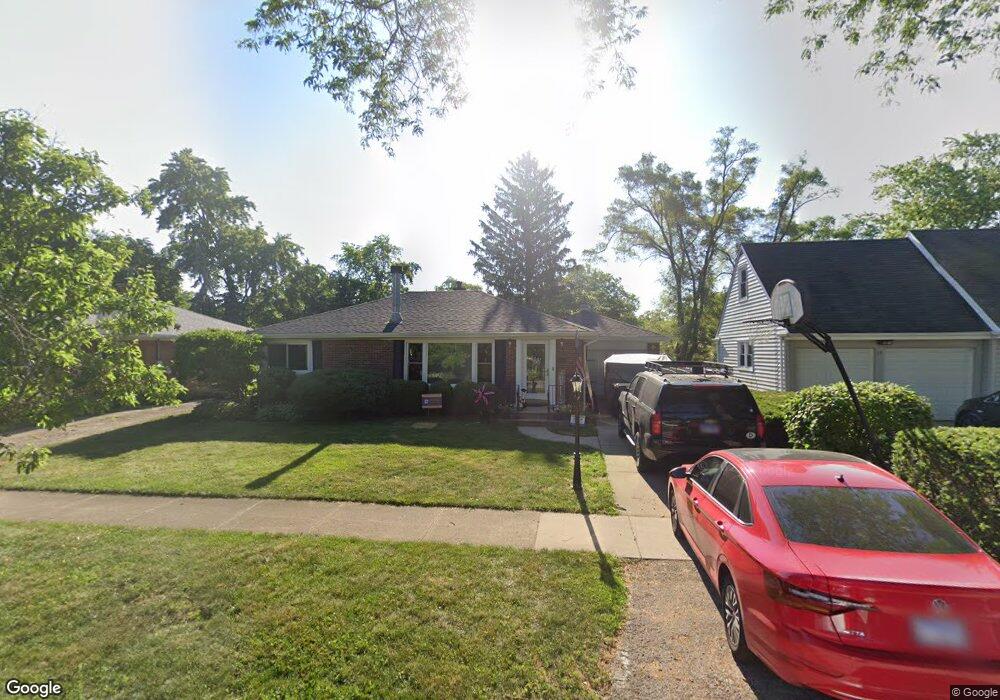
17 N Kennicott Ave Arlington Heights, IL 60005
Estimated Value: $477,000 - $526,000
3
Beds
2
Baths
1,262
Sq Ft
$397/Sq Ft
Est. Value
About This Home
This home is located at 17 N Kennicott Ave, Arlington Heights, IL 60005 and is currently estimated at $501,015, approximately $397 per square foot. 17 N Kennicott Ave is a home located in Cook County with nearby schools including Westgate Elementary School, South Middle School, and Rolling Meadows High School.
Ownership History
Date
Name
Owned For
Owner Type
Purchase Details
Closed on
Sep 18, 2009
Sold by
Meek Jon E and Meek Kristin C
Bought by
Thomas Justin and Thomas Anna Katharina
Current Estimated Value
Home Financials for this Owner
Home Financials are based on the most recent Mortgage that was taken out on this home.
Original Mortgage
$294,566
Outstanding Balance
$192,645
Interest Rate
5.19%
Mortgage Type
FHA
Estimated Equity
$308,370
Purchase Details
Closed on
Sep 27, 2002
Sold by
Winikates Robert C
Bought by
Meek Jon E and Meek Kristin C
Home Financials for this Owner
Home Financials are based on the most recent Mortgage that was taken out on this home.
Original Mortgage
$225,000
Interest Rate
6.39%
Purchase Details
Closed on
Feb 10, 2000
Sold by
Winikates Robert C and Winikates Joanne B
Bought by
Winikates Robert C and Robert C Winikates Family Living Trust
Create a Home Valuation Report for This Property
The Home Valuation Report is an in-depth analysis detailing your home's value as well as a comparison with similar homes in the area
Home Values in the Area
Average Home Value in this Area
Purchase History
| Date | Buyer | Sale Price | Title Company |
|---|---|---|---|
| Thomas Justin | $300,000 | Multiple | |
| Meek Jon E | -- | 1St American Title | |
| Winikates Robert C | -- | -- |
Source: Public Records
Mortgage History
| Date | Status | Borrower | Loan Amount |
|---|---|---|---|
| Open | Thomas Justin | $294,566 | |
| Previous Owner | Meek Jon E | $225,000 |
Source: Public Records
Tax History Compared to Growth
Tax History
| Year | Tax Paid | Tax Assessment Tax Assessment Total Assessment is a certain percentage of the fair market value that is determined by local assessors to be the total taxable value of land and additions on the property. | Land | Improvement |
|---|---|---|---|---|
| 2024 | $8,674 | $35,000 | $7,920 | $27,080 |
| 2023 | $8,326 | $35,000 | $7,920 | $27,080 |
| 2022 | $8,326 | $35,000 | $7,920 | $27,080 |
| 2021 | $6,913 | $26,296 | $4,950 | $21,346 |
| 2020 | $6,801 | $26,296 | $4,950 | $21,346 |
| 2019 | $6,771 | $29,218 | $4,950 | $24,268 |
| 2018 | $6,990 | $27,388 | $4,356 | $23,032 |
| 2017 | $6,925 | $27,388 | $4,356 | $23,032 |
| 2016 | $6,695 | $27,388 | $4,356 | $23,032 |
| 2015 | $6,658 | $25,173 | $3,762 | $21,411 |
| 2014 | $6,480 | $25,173 | $3,762 | $21,411 |
| 2013 | $6,300 | $25,173 | $3,762 | $21,411 |
Source: Public Records
Map
Nearby Homes
- 24 S Kaspar Ave
- 12 S Princeton Ct
- 222 S Dwyer Ave
- 514 W Miner St Unit 2F
- 1419 W Miner St
- 1418 W Saint James Place
- 34 N Reuter Dr
- 318 W Wing St
- 314 W Wing St
- 105 S Mitchell Ave
- 1615 W Johanna Terrace
- 151 W Wing St Unit 301
- 1 S Highland Ave Unit 800
- 1 S Highland Ave Unit 400
- 316 S Reuter Dr
- 105 S Vail Ave
- 617 N Wilke Rd
- 201 N Vail Ave Unit 305
- 121 S Vail Ave Unit 403
- 121 S Vail Ave Unit 401
- 15 N Kennicott Ave
- 21 N Kennicott Ave
- 25 N Kennicott Ave
- 12 N Kaspar Ave
- 16 N Kaspar Ave
- 8 N Kaspar Ave
- 20 N Kaspar Ave
- 36 N Kennicott Ave
- 103 N Kennicott Ave
- 908 W Campbell St
- 22 N Kennicott Ave
- 20 N Kennicott Ave
- 10 N Kennicott Ave
- 102 N Kaspar Ave
- 900 W Campbell St
- 105 N Kennicott Ave
- 1004 W Campbell St
- 106 N Kaspar Ave
- 9 N Kennicott Ave
- 1015 W Wing St