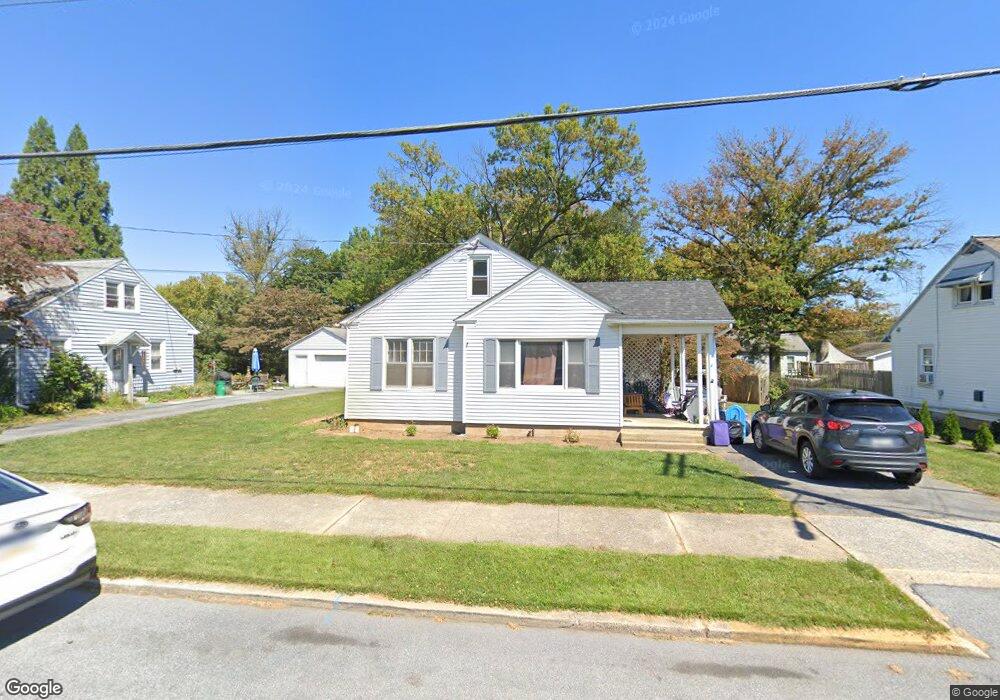
17 N Laurel St Manheim, PA 17545
Estimated Value: $229,000 - $278,000
3
Beds
1
Bath
1,151
Sq Ft
$224/Sq Ft
Est. Value
About This Home
This home is located at 17 N Laurel St, Manheim, PA 17545 and is currently estimated at $257,927, approximately $224 per square foot. 17 N Laurel St is a home located in Lancaster County with nearby schools including Manheim Central Senior High School, Manheim Christian Day School, and Sporting Hill Christian School.
Ownership History
Date
Name
Owned For
Owner Type
Purchase Details
Closed on
Mar 5, 2020
Sold by
Brubaker Leah K and Brubaker Carl J
Bought by
Enterline Mary Ellen
Current Estimated Value
Home Financials for this Owner
Home Financials are based on the most recent Mortgage that was taken out on this home.
Original Mortgage
$99,677
Outstanding Balance
$88,445
Interest Rate
3.6%
Mortgage Type
Seller Take Back
Estimated Equity
$169,482
Purchase Details
Closed on
Jun 6, 1997
Bought by
Brubaker Brubaker J and Brubaker Leah K
Create a Home Valuation Report for This Property
The Home Valuation Report is an in-depth analysis detailing your home's value as well as a comparison with similar homes in the area
Home Values in the Area
Average Home Value in this Area
Purchase History
| Date | Buyer | Sale Price | Title Company |
|---|---|---|---|
| Enterline Mary Ellen | $130,000 | None Available | |
| Brubaker Brubaker J | -- | -- |
Source: Public Records
Mortgage History
| Date | Status | Borrower | Loan Amount |
|---|---|---|---|
| Open | Enterline Mary Ellen | $99,677 |
Source: Public Records
Tax History Compared to Growth
Tax History
| Year | Tax Paid | Tax Assessment Tax Assessment Total Assessment is a certain percentage of the fair market value that is determined by local assessors to be the total taxable value of land and additions on the property. | Land | Improvement |
|---|---|---|---|---|
| 2025 | $2,915 | $121,000 | $50,700 | $70,300 |
| 2024 | $2,915 | $121,000 | $50,700 | $70,300 |
| 2023 | $2,864 | $121,000 | $50,700 | $70,300 |
| 2022 | $2,771 | $121,000 | $50,700 | $70,300 |
| 2021 | $2,688 | $121,000 | $50,700 | $70,300 |
| 2020 | $2,688 | $121,000 | $50,700 | $70,300 |
| 2019 | $2,648 | $121,000 | $50,700 | $70,300 |
| 2018 | $1,734 | $121,000 | $50,700 | $70,300 |
| 2017 | $2,733 | $99,900 | $29,800 | $70,100 |
| 2016 | $2,653 | $99,900 | $29,800 | $70,100 |
| 2015 | $878 | $99,900 | $29,800 | $70,100 |
| 2014 | $1,717 | $99,900 | $29,800 | $70,100 |
Source: Public Records
Map
Nearby Homes
- 239 E High St
- 121 Mill St
- 108 110 S Main St
- 123 S Main St
- 125 S Main St
- 27 W Ferdinand St
- 33 W Ferdinand St
- 37 W Ferdinand St
- 2 S Charlotte St
- 43 W Ferdinand St
- 188 N Main St
- 140 S Charlotte St
- 55 S Grant St
- 162 N Charlotte St
- 113 S Grant St
- 28 N Grant St
- 218 W Ferdinand St
- 321 S Cherry St
- 609 Hamaker Rd
- 32 S Fulton St