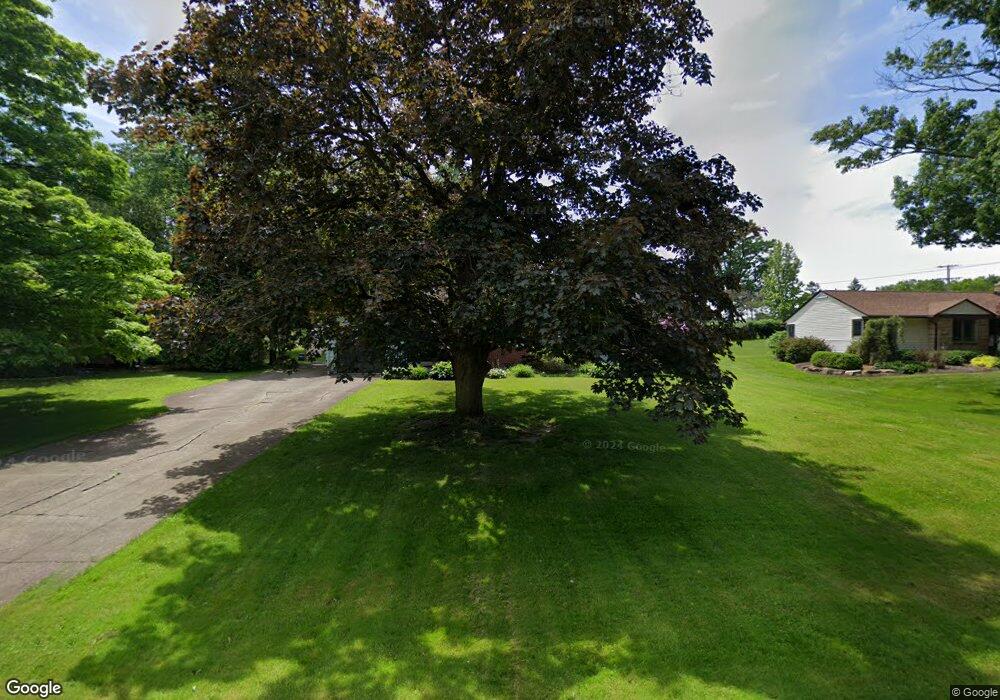
17 Neff Dr Canfield, OH 44406
Estimated Value: $136,000 - $217,117
3
Beds
2
Baths
936
Sq Ft
$200/Sq Ft
Est. Value
About This Home
This home is located at 17 Neff Dr, Canfield, OH 44406 and is currently estimated at $186,779, approximately $199 per square foot. 17 Neff Dr is a home located in Mahoning County with nearby schools including Canfield Village Middle School and Canfield High School.
Ownership History
Date
Name
Owned For
Owner Type
Purchase Details
Closed on
Jul 31, 2023
Sold by
Kotouch Christina A and Kotouch Christine Ann
Bought by
Sotack Evan and Sotack Luke
Current Estimated Value
Purchase Details
Closed on
Jul 10, 2023
Sold by
Kotouch Christine Ann and Kotouch Christina A
Bought by
Sotack G Douglas G and Sotack Evan
Purchase Details
Closed on
Dec 8, 2017
Sold by
Halchuck Michael J and Us Bank N A
Bought by
Kotouch Christina A
Purchase Details
Closed on
May 24, 2017
Sold by
Halchuck Michael J and U S Bank Na
Bought by
Kotouch Christina A
Purchase Details
Closed on
Jan 21, 2008
Sold by
Buccilli Robert E and Buccilli Mary A
Bought by
Halchuck Michael J and Halchuck Ashley M
Home Financials for this Owner
Home Financials are based on the most recent Mortgage that was taken out on this home.
Original Mortgage
$116,082
Interest Rate
5.95%
Mortgage Type
FHA
Purchase Details
Closed on
Jan 22, 1986
Bought by
Buccilli Robert E and Buccilli Mary A
Create a Home Valuation Report for This Property
The Home Valuation Report is an in-depth analysis detailing your home's value as well as a comparison with similar homes in the area
Home Values in the Area
Average Home Value in this Area
Purchase History
| Date | Buyer | Sale Price | Title Company |
|---|---|---|---|
| Sotack Evan | -- | -- | |
| Sotack G Douglas G | -- | -- | |
| Kotouch Christina A | $400,400 | None Available | |
| Kotouch Christina A | -- | None Available | |
| Halchuck Michael J | $147,000 | Attorney | |
| Buccilli Robert E | $48,500 | -- |
Source: Public Records
Mortgage History
| Date | Status | Borrower | Loan Amount |
|---|---|---|---|
| Previous Owner | Halchuck Michael J | $116,082 |
Source: Public Records
Tax History Compared to Growth
Tax History
| Year | Tax Paid | Tax Assessment Tax Assessment Total Assessment is a certain percentage of the fair market value that is determined by local assessors to be the total taxable value of land and additions on the property. | Land | Improvement |
|---|---|---|---|---|
| 2024 | $2,755 | $62,600 | $12,090 | $50,510 |
| 2023 | $2,712 | $62,600 | $12,090 | $50,510 |
| 2022 | $2,589 | $45,300 | $11,210 | $34,090 |
| 2021 | $2,395 | $45,300 | $11,210 | $34,090 |
| 2020 | $2,404 | $45,300 | $11,210 | $34,090 |
| 2019 | $2,452 | $41,930 | $11,210 | $30,720 |
| 2018 | $2,499 | $41,930 | $11,210 | $30,720 |
| 2017 | $2,395 | $41,930 | $11,210 | $30,720 |
| 2016 | $2,193 | $38,370 | $8,250 | $30,120 |
| 2015 | $2,495 | $38,370 | $8,250 | $30,120 |
| 2014 | $2,090 | $38,370 | $8,250 | $30,120 |
| 2013 | $2,015 | $38,370 | $8,250 | $30,120 |
Source: Public Records
Map
Nearby Homes
- 78 Neff Dr
- 38 Skyline Dr
- 125 Callahan Rd
- 58 Skyline Dr
- 6020 Century Blvd
- 395 N Broad St
- 227 Cross St
- 331 Verdant Ln
- 225 Sleepy Hollow Dr
- 21 Villa Theresa Ln
- 31 Villa Theresa Ln
- 10 Villa Theresa Ln
- 90 Villa Theresa Ln
- 20 Villa Theresa Ln
- 30 Villa Theresa Ln
- 301 Hilltop Blvd
- 365 Sleepy Hollow Dr
- 419 Carriage Hill Dr
- 321 Hilltop Blvd
- 473 Carriage Hill Dr