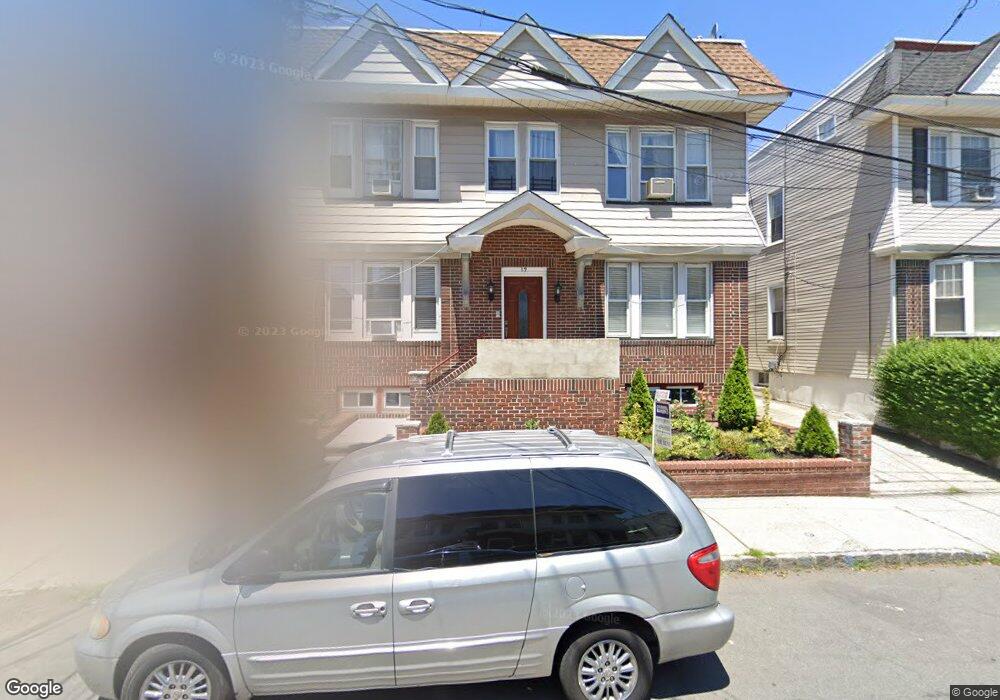
17 Nelson Place Unit 2 R Maplewood, NJ 07040
Estimated Value: $867,176 - $1,009,000
3
Beds
1
Bath
3,672
Sq Ft
$259/Sq Ft
Est. Value
About This Home
This home is located at 17 Nelson Place Unit 2 R, Maplewood, NJ 07040 and is currently estimated at $950,294, approximately $258 per square foot. 17 Nelson Place Unit 2 R is a home located in Essex County with nearby schools including Seth Boyden Elementary School, Maplewood Middle School, and Columbia Senior High School.
Ownership History
Date
Name
Owned For
Owner Type
Purchase Details
Closed on
Aug 4, 2014
Sold by
Castor Pierre A
Bought by
St Arromand Dingane R
Current Estimated Value
Home Financials for this Owner
Home Financials are based on the most recent Mortgage that was taken out on this home.
Interest Rate
4.12%
Purchase Details
Closed on
Sep 7, 2013
Bought by
St Arromand Dingane Richard
Purchase Details
Closed on
Jun 26, 2012
Sold by
Castor Jean Marcel and Castor Pierre Anna
Bought by
St Arromand Dingane Richard
Purchase Details
Closed on
Mar 31, 1993
Sold by
Stein Ellen
Bought by
Castor Pierre Anna and Castor Jean
Create a Home Valuation Report for This Property
The Home Valuation Report is an in-depth analysis detailing your home's value as well as a comparison with similar homes in the area
Home Values in the Area
Average Home Value in this Area
Purchase History
| Date | Buyer | Sale Price | Title Company |
|---|---|---|---|
| St Arromand Dingane R | -- | -- | |
| St Arromand Dingane Richard | -- | -- | |
| St Arromand Dingane Richard | -- | None Available | |
| Castor Pierre Anna | $200,000 | -- |
Source: Public Records
Mortgage History
| Date | Status | Borrower | Loan Amount |
|---|---|---|---|
| Closed | St Arromand Dingane R | -- |
Source: Public Records
Tax History Compared to Growth
Tax History
| Year | Tax Paid | Tax Assessment Tax Assessment Total Assessment is a certain percentage of the fair market value that is determined by local assessors to be the total taxable value of land and additions on the property. | Land | Improvement |
|---|---|---|---|---|
| 2025 | $14,431 | $689,200 | $210,800 | $478,400 |
| 2024 | $14,431 | $689,200 | $210,800 | $478,400 |
| 2022 | $14,072 | $399,100 | $125,600 | $273,500 |
| 2021 | $13,645 | $399,100 | $125,600 | $273,500 |
| 2020 | $13,258 | $399,100 | $125,600 | $273,500 |
| 2019 | $12,875 | $399,100 | $125,600 | $273,500 |
| 2018 | $12,544 | $399,100 | $125,600 | $273,500 |
| 2017 | $12,169 | $399,100 | $125,600 | $273,500 |
| 2016 | $14,069 | $381,800 | $108,000 | $273,800 |
| 2015 | $16,337 | $453,800 | $108,000 | $345,800 |
| 2014 | $15,992 | $453,800 | $108,000 | $345,800 |
Source: Public Records
Map
Nearby Homes
- 30 Nelson Place
- 168 Jacoby St
- 25 Evelyn Ct
- 26 Van Ness Terrace
- 37 Menzel Ave
- 79 Coolidge St
- 75 Coolidge St
- 74 Hughes St
- 29 Schaefer Rd
- 179 Hollywood Ave
- 2043-2045 Ostwood Terrace
- 30 Harding Terrace
- 12 44th St
- 74 Burnett Ave
- 74 Burnett Ave Unit 2
- 36 Olympic Terrace
- 34 Olympic Terrace
- 6 Field Rd
- 18 Boyden Pkwy S
- 1683 Van Ness Terrace
- 17 Nelson Place
- 17 Nelson Place Unit 2L
- 15 Nelson Place
- 15 Nelson Place Unit 4
- 15 Nelson Place Unit 2
- 15 Nelson Place Unit 1
- 15 Nelson Place Unit 1R
- 21 Nelson Place
- 21 Nelson Place Unit 4
- 21 Nelson Place Unit 2L
- 21 Nelson Place Unit 1R
- 21 Nelson Place Unit 1L
- 21 Nelson Place Unit 2R
- 13 Nelson Place
- 8 Gifford Ct
- 25 Nelson Place Unit 4
- 25 Nelson Place
- 25 Nelson Place Unit 1L
- 6 Gifford Ct
- 10 Gifford Ct