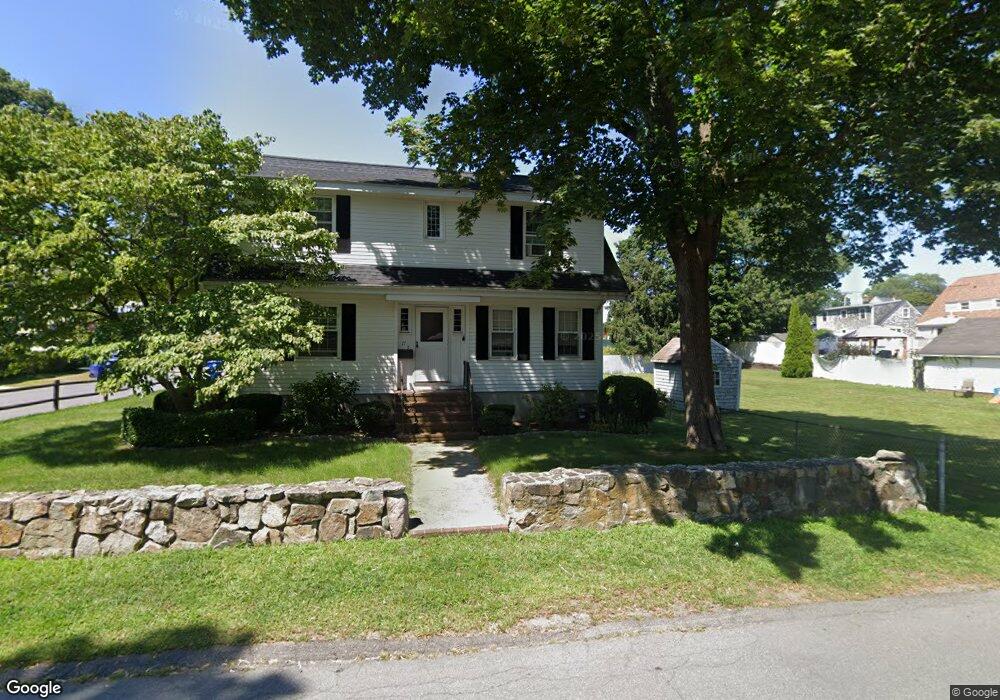
17 Nelson St Braintree, MA 02184
East Braintree NeighborhoodEstimated Value: $693,936 - $733,000
3
Beds
3
Baths
1,998
Sq Ft
$359/Sq Ft
Est. Value
About This Home
This home is located at 17 Nelson St, Braintree, MA 02184 and is currently estimated at $716,484, approximately $358 per square foot. 17 Nelson St is a home located in Norfolk County with nearby schools including Braintree High School, Sacred Heart Elementary School, and South Shore Christian Academy.
Ownership History
Date
Name
Owned For
Owner Type
Purchase Details
Closed on
Apr 11, 2023
Sold by
Caledonia Robert J
Bought by
Caledonia Family Irt
Current Estimated Value
Purchase Details
Closed on
Apr 11, 2022
Sold by
Caledonia Robert J and Caledonia Maria E
Bought by
Caledonia Robert J
Purchase Details
Closed on
Oct 31, 2011
Sold by
Caledonia Robert J and Caledonia Maria E
Bought by
Caledonia Rt and Caledonia Robert J
Purchase Details
Closed on
May 23, 1977
Bought by
Caledonia Rt
Create a Home Valuation Report for This Property
The Home Valuation Report is an in-depth analysis detailing your home's value as well as a comparison with similar homes in the area
Home Values in the Area
Average Home Value in this Area
Purchase History
We collect this data history from publicly available records. To have your information removed, we recommend requesting removal directly through your county’s website.
| Date | Buyer | Sale Price | Title Company |
|---|---|---|---|
| Caledonia Family Irt | -- | None Available | |
| Caledonia Robert J | -- | None Available | |
| Caledonia Robert J | -- | None Available | |
| Caledonia Rt | -- | -- | |
| Caledonia Rt | -- | -- |
Source: Public Records
Mortgage History
We collect this data history from publicly available records. To have your information removed, we recommend requesting removal directly through your county’s website.
| Date | Status | Borrower | Loan Amount |
|---|---|---|---|
| Previous Owner | Caledonia Rt | $250,000 | |
| Previous Owner | Caledonia Rt | $60,000 | |
| Previous Owner | Caledonia Rt | $43,000 |
Source: Public Records
Tax History
| Year | Tax Paid | Tax Assessment Tax Assessment Total Assessment is a certain percentage of the fair market value that is determined by local assessors to be the total taxable value of land and additions on the property. | Land | Improvement |
|---|---|---|---|---|
| 2025 | $6,246 | $625,900 | $330,800 | $295,100 |
| 2024 | $5,703 | $601,600 | $308,400 | $293,200 |
| 2023 | $5,411 | $554,400 | $277,100 | $277,300 |
| 2022 | $5,250 | $527,600 | $250,300 | $277,300 |
| 2021 | $4,851 | $487,500 | $226,200 | $261,300 |
| 2020 | $4,493 | $455,700 | $205,600 | $250,100 |
| 2019 | $4,330 | $429,100 | $196,700 | $232,400 |
| 2018 | $4,233 | $401,600 | $178,800 | $222,800 |
| 2017 | $4,080 | $379,900 | $169,900 | $210,000 |
| 2016 | $3,780 | $344,300 | $143,000 | $201,300 |
| 2015 | $3,713 | $335,400 | $141,300 | $194,100 |
| 2014 | $3,523 | $308,500 | $128,700 | $179,800 |
Source: Public Records
Map
Nearby Homes
- 7 Somerville Ave
- 16 Cotton Ave
- 25 Fairmount Ave
- 28 Hillcrest Rd
- 146 Hayward St
- 24 Hillside Ave
- 296 Commercial St Unit 21
- 51 Faxon St
- 67 Trefton Dr
- 30 Skyline Dr Unit 6
- 37 Lantern Ln
- 37 Skyline Dr Unit 11
- 67 Washington St
- 25 W Howard St Unit G3
- 12 Franklin St
- 115 Pilgrim Rd
- 27 Cindy Ln
- 485 Union St
- 99 Louise Rd
- 38 Stonewood Ln
Your Personal Tour Guide
Ask me questions while you tour the home.