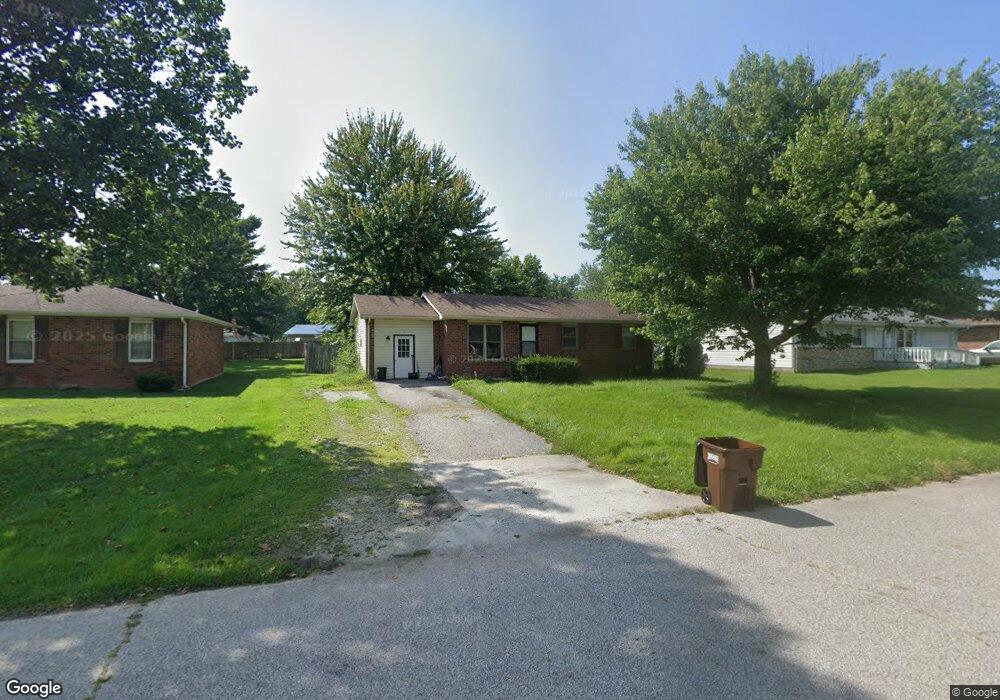
17 Noon Dr North Vernon, IN 47265
Estimated Value: $175,002 - $198,000
3
Beds
1
Bath
1,252
Sq Ft
$149/Sq Ft
Est. Value
About This Home
This home is located at 17 Noon Dr, North Vernon, IN 47265 and is currently estimated at $186,751, approximately $149 per square foot. 17 Noon Dr is a home located in Jennings County with nearby schools including North Vernon Elementary School, Jennings County Middle School, and Jennings County High School.
Ownership History
Date
Name
Owned For
Owner Type
Purchase Details
Closed on
Sep 30, 2019
Sold by
Nigliazzo Ben
Bought by
Nigliazzo Property Mgmt & Sales Inc
Current Estimated Value
Purchase Details
Closed on
May 15, 2019
Sold by
Gosman Thomas Joseph and Gosman Elizabeth E
Bought by
Nigliazzo Ben
Home Financials for this Owner
Home Financials are based on the most recent Mortgage that was taken out on this home.
Original Mortgage
$63,200
Interest Rate
4.37%
Mortgage Type
Adjustable Rate Mortgage/ARM
Purchase Details
Closed on
Nov 21, 2007
Sold by
%Homeq Servicing Wells Fargo Bank
Bought by
Gosman Thomas
Purchase Details
Closed on
Nov 19, 2007
Sold by
Wells Fargo Bank Na
Bought by
Gosman Thomas
Purchase Details
Closed on
Oct 23, 2007
Sold by
Hoppock Sheriff Steve
Bought by
%Homeq Servicing Wells Fargo Bank
Purchase Details
Closed on
Jun 26, 1998
Sold by
Hayden Investments
Bought by
Byard Kathy D
Create a Home Valuation Report for This Property
The Home Valuation Report is an in-depth analysis detailing your home's value as well as a comparison with similar homes in the area
Home Values in the Area
Average Home Value in this Area
Purchase History
| Date | Buyer | Sale Price | Title Company |
|---|---|---|---|
| Nigliazzo Property Mgmt & Sales Inc | -- | None Available | |
| Nigliazzo Ben | -- | None Available | |
| Gosman Thomas | $62,500 | C & R Title Services | |
| Gosman Thomas | -- | None Available | |
| %Homeq Servicing Wells Fargo Bank | $53,418 | C & R Title | |
| Wells Fargo Bank Na | $53,418 | None Available | |
| Byard Kathy D | $63,000 | -- |
Source: Public Records
Mortgage History
| Date | Status | Borrower | Loan Amount |
|---|---|---|---|
| Previous Owner | Nigliazzo Ben | $63,200 |
Source: Public Records
Tax History Compared to Growth
Tax History
| Year | Tax Paid | Tax Assessment Tax Assessment Total Assessment is a certain percentage of the fair market value that is determined by local assessors to be the total taxable value of land and additions on the property. | Land | Improvement |
|---|---|---|---|---|
| 2024 | $1,512 | $75,600 | $9,500 | $66,100 |
| 2023 | $1,498 | $74,900 | $9,500 | $65,400 |
| 2022 | $1,484 | $74,200 | $9,500 | $64,700 |
| 2021 | $1,412 | $70,600 | $9,500 | $61,100 |
| 2020 | $1,310 | $65,500 | $9,500 | $56,000 |
| 2019 | $1,232 | $61,600 | $9,500 | $52,100 |
| 2018 | $1,232 | $61,600 | $9,500 | $52,100 |
| 2017 | $1,216 | $60,800 | $9,500 | $51,300 |
| 2016 | $1,244 | $62,200 | $9,500 | $52,700 |
| 2014 | $1,434 | $71,700 | $13,000 | $58,700 |
Source: Public Records
Map
Nearby Homes
- 46 Noon Dr
- 1675 Twin Oaks Dr
- 1785 W Brownstown Rd
- 0 W Walnut St Unit MBR22050857
- 310 Tiffany Ln
- 201 W Hayden Pike
- 1905 W Brownstown Rd
- 10 Hicks St
- 52 W Poplar St
- 604 N Elm St
- 104 Meadow Ln
- 0 Henry St
- 333 Oakridge Dr
- 82 Norris Ave
- 210 Norris Ave
- 62 Brookside Dr
- 215 S Gum St
- 25 W Chestnut St
- 3 S State St
- 208 South St