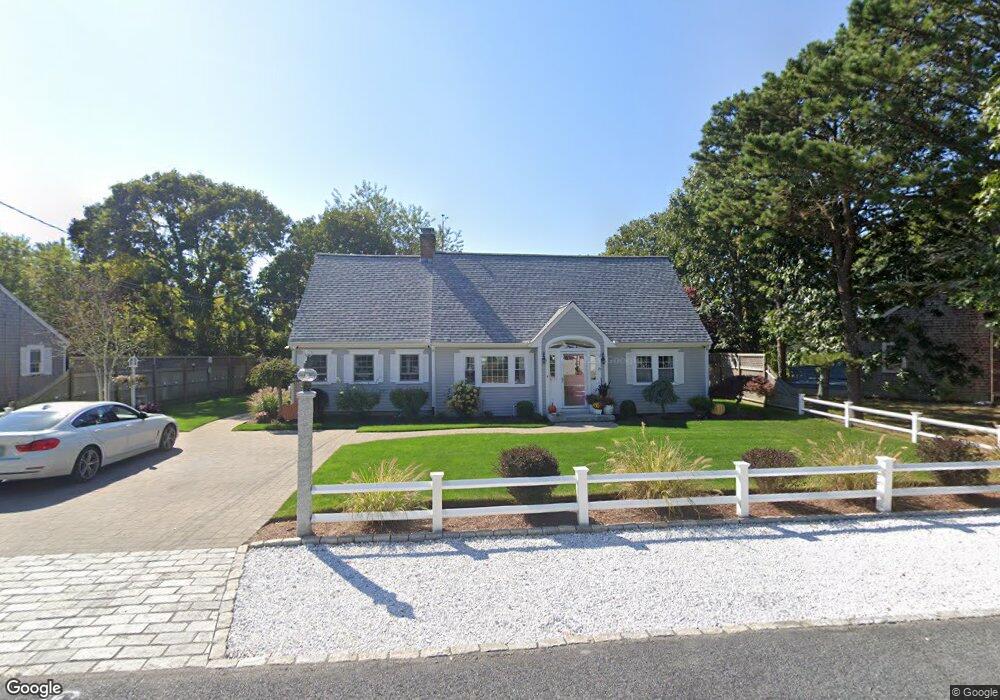
17 North Rd West Dennis, MA 02670
West Dennis NeighborhoodEstimated Value: $909,000 - $1,677,000
4
Beds
3
Baths
1,812
Sq Ft
$620/Sq Ft
Est. Value
About This Home
This home is located at 17 North Rd, West Dennis, MA 02670 and is currently estimated at $1,124,156, approximately $620 per square foot. 17 North Rd is a home located in Barnstable County with nearby schools including Dennis-Yarmouth Regional High School and St. Pius X. School.
Ownership History
Date
Name
Owned For
Owner Type
Purchase Details
Closed on
Aug 11, 2014
Sold by
Collotta Steven S and Collotta Joy G
Bought by
Collotta Rt and Collotta Steven S
Current Estimated Value
Purchase Details
Closed on
Apr 11, 2014
Sold by
Collott Rt and Collotta Steven S
Bought by
Collotta Steven S and Collotta Joy G
Purchase Details
Closed on
Feb 14, 2002
Sold by
Collotta Alfred R and Collotta Dorothy A
Bought by
Collotta Rt and Collotta Steven S
Home Financials for this Owner
Home Financials are based on the most recent Mortgage that was taken out on this home.
Original Mortgage
$225,000
Interest Rate
7.14%
Mortgage Type
Purchase Money Mortgage
Create a Home Valuation Report for This Property
The Home Valuation Report is an in-depth analysis detailing your home's value as well as a comparison with similar homes in the area
Home Values in the Area
Average Home Value in this Area
Purchase History
| Date | Buyer | Sale Price | Title Company |
|---|---|---|---|
| Collotta Rt | -- | -- | |
| Collotta Steven S | -- | -- | |
| Collotta Rt | $250,000 | -- |
Source: Public Records
Mortgage History
| Date | Status | Borrower | Loan Amount |
|---|---|---|---|
| Previous Owner | Collotta Rt | $225,000 |
Source: Public Records
Tax History Compared to Growth
Tax History
| Year | Tax Paid | Tax Assessment Tax Assessment Total Assessment is a certain percentage of the fair market value that is determined by local assessors to be the total taxable value of land and additions on the property. | Land | Improvement |
|---|---|---|---|---|
| 2025 | $3,650 | $842,900 | $266,700 | $576,200 |
| 2024 | $3,547 | $808,000 | $256,500 | $551,500 |
| 2023 | $3,400 | $728,100 | $226,700 | $501,400 |
| 2022 | $3,347 | $597,700 | $221,700 | $376,000 |
| 2021 | $3,271 | $542,500 | $217,300 | $325,200 |
| 2020 | $3,826 | $568,800 | $240,200 | $328,600 |
| 2019 | $2,722 | $441,100 | $168,200 | $272,900 |
| 2018 | $3,093 | $487,800 | $224,200 | $263,600 |
| 2017 | $2,672 | $434,400 | $170,800 | $263,600 |
| 2016 | $2,756 | $422,100 | $197,500 | $224,600 |
| 2015 | $2,701 | $422,100 | $197,500 | $224,600 |
| 2014 | $2,432 | $383,000 | $165,500 | $217,500 |
Source: Public Records
Map
Nearby Homes
- 2 Rita Mary Way
- 14 Schoolhouse Ln
- 209 Main St Unit 3
- 209 Main St Unit 6
- 209 Main St Unit 1
- 209 Main St Unit 2
- 209 Main St Unit 4
- 209 Main St Unit 5
- 178 School St
- 23 Doric Ave
- 308 Old Main St
- 401 Main St Unit 201
- 401 Main St Unit 101
- 45 Seth Ln
- 40 Kelley Rd
- 181 Pleasant St
- 467 Main St
- 428 Main St Unit 1-11
- 29 Bass River Rd
- 18 Turner Ln