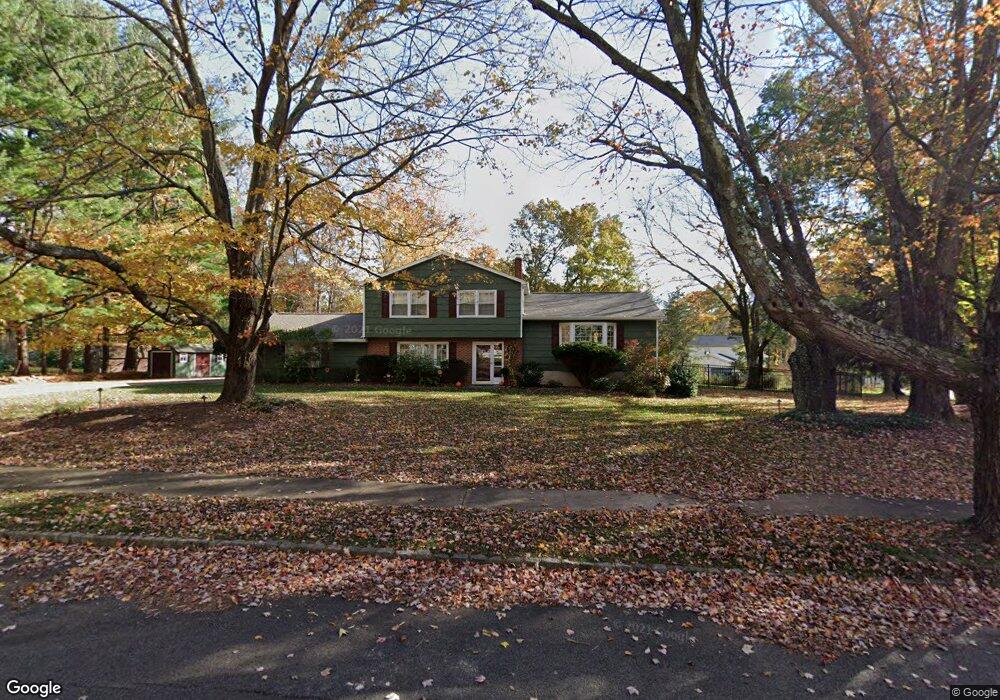
17 Nyma Way Succasunna, NJ 07876
Estimated Value: $637,259 - $700,000
--
Bed
--
Bath
1,912
Sq Ft
$354/Sq Ft
Est. Value
About This Home
This home is located at 17 Nyma Way, Succasunna, NJ 07876 and is currently estimated at $677,065, approximately $354 per square foot. 17 Nyma Way is a home located in Morris County with nearby schools including Lincoln Roosevelt Elementary School, Eisenhower Middle School, and Roxbury High School.
Ownership History
Date
Name
Owned For
Owner Type
Purchase Details
Closed on
Mar 30, 2000
Sold by
Jouas Paul and Jouas Sharon
Bought by
Michaels Michael and Michaels Linda
Current Estimated Value
Home Financials for this Owner
Home Financials are based on the most recent Mortgage that was taken out on this home.
Original Mortgage
$265,500
Outstanding Balance
$89,454
Interest Rate
8%
Estimated Equity
$587,611
Purchase Details
Closed on
Feb 23, 1996
Sold by
Franco Benjamin J and Franco Anne J
Bought by
Jouas Paul and Jouas Sharon
Create a Home Valuation Report for This Property
The Home Valuation Report is an in-depth analysis detailing your home's value as well as a comparison with similar homes in the area
Home Values in the Area
Average Home Value in this Area
Purchase History
| Date | Buyer | Sale Price | Title Company |
|---|---|---|---|
| Michaels Michael | $295,000 | -- | |
| Jouas Paul | $229,000 | -- |
Source: Public Records
Mortgage History
| Date | Status | Borrower | Loan Amount |
|---|---|---|---|
| Open | Michaels Michael | $265,500 |
Source: Public Records
Tax History Compared to Growth
Tax History
| Year | Tax Paid | Tax Assessment Tax Assessment Total Assessment is a certain percentage of the fair market value that is determined by local assessors to be the total taxable value of land and additions on the property. | Land | Improvement |
|---|---|---|---|---|
| 2025 | $10,240 | $372,500 | $153,700 | $218,800 |
| 2024 | $10,080 | $372,500 | $153,700 | $218,800 |
| 2023 | $10,080 | $372,500 | $153,700 | $218,800 |
| 2022 | $9,812 | $372,500 | $153,700 | $218,800 |
| 2021 | $9,812 | $372,500 | $153,700 | $218,800 |
| 2020 | $9,793 | $372,500 | $153,700 | $218,800 |
| 2019 | $9,611 | $372,500 | $153,700 | $218,800 |
| 2018 | $10,292 | $238,800 | $89,400 | $149,400 |
| 2017 | $10,237 | $238,800 | $89,400 | $149,400 |
| 2016 | $10,037 | $238,800 | $89,400 | $149,400 |
| 2015 | $9,788 | $238,800 | $89,400 | $149,400 |
| 2014 | $9,633 | $238,800 | $89,400 | $149,400 |
Source: Public Records
Map
Nearby Homes