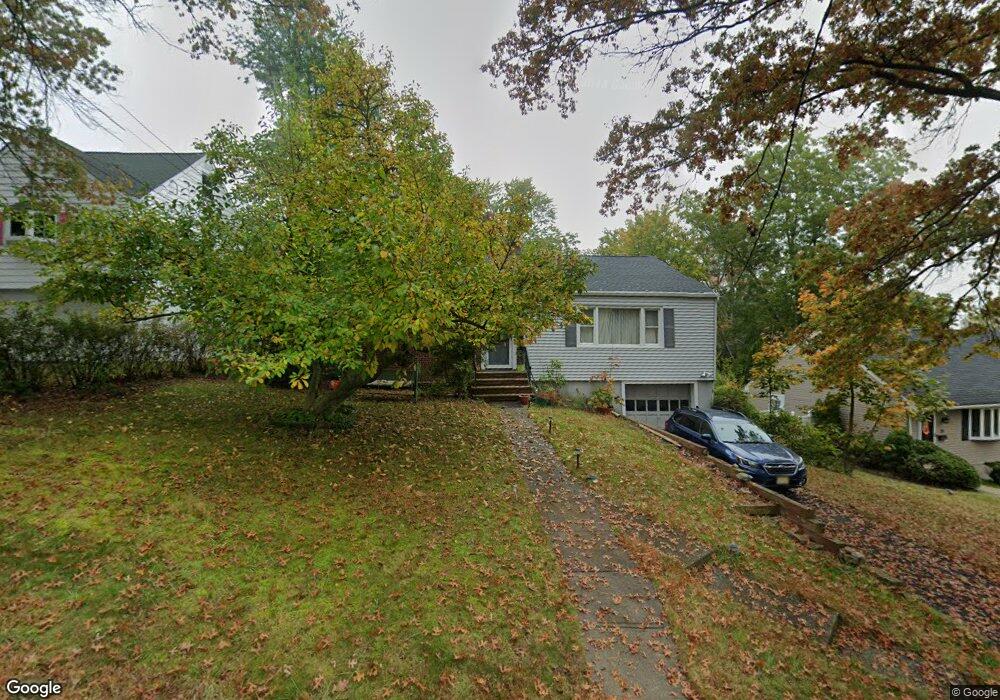
17 Oak Crest Rd West Orange, NJ 07052
Estimated Value: $517,769 - $700,000
--
Bed
--
Bath
1,444
Sq Ft
$440/Sq Ft
Est. Value
About This Home
This home is located at 17 Oak Crest Rd, West Orange, NJ 07052 and is currently estimated at $635,692, approximately $440 per square foot. 17 Oak Crest Rd is a home located in Essex County with nearby schools including West Orange High School, Golda Och Academy, and Aquinas Academy.
Ownership History
Date
Name
Owned For
Owner Type
Purchase Details
Closed on
Oct 29, 1999
Sold by
Dunne Owen
Bought by
Wagersreiter Thomas
Current Estimated Value
Home Financials for this Owner
Home Financials are based on the most recent Mortgage that was taken out on this home.
Original Mortgage
$137,600
Outstanding Balance
$42,040
Interest Rate
7.76%
Estimated Equity
$593,652
Purchase Details
Closed on
Jul 29, 1998
Sold by
Vasudevan Tirucherai
Bought by
Dunne Owen C and Dunne Gwynne R
Home Financials for this Owner
Home Financials are based on the most recent Mortgage that was taken out on this home.
Original Mortgage
$136,800
Interest Rate
6.92%
Purchase Details
Closed on
Oct 11, 1993
Sold by
Babij Andrew
Bought by
Vasudevan Tirucheri and Vasudevan Gayathri
Home Financials for this Owner
Home Financials are based on the most recent Mortgage that was taken out on this home.
Original Mortgage
$158,000
Interest Rate
6.79%
Create a Home Valuation Report for This Property
The Home Valuation Report is an in-depth analysis detailing your home's value as well as a comparison with similar homes in the area
Home Values in the Area
Average Home Value in this Area
Purchase History
| Date | Buyer | Sale Price | Title Company |
|---|---|---|---|
| Wagersreiter Thomas | $172,000 | -- | |
| Dunne Owen C | $171,000 | -- | |
| Vasudevan Tirucheri | $178,000 | -- |
Source: Public Records
Mortgage History
| Date | Status | Borrower | Loan Amount |
|---|---|---|---|
| Open | Wagersreiter Thomas | $137,600 | |
| Previous Owner | Dunne Owen C | $136,800 | |
| Previous Owner | Vasudevan Tirucheri | $158,000 |
Source: Public Records
Tax History Compared to Growth
Tax History
| Year | Tax Paid | Tax Assessment Tax Assessment Total Assessment is a certain percentage of the fair market value that is determined by local assessors to be the total taxable value of land and additions on the property. | Land | Improvement |
|---|---|---|---|---|
| 2025 | $11,343 | $519,900 | $295,400 | $224,500 |
| 2024 | $11,343 | $246,700 | $130,400 | $116,300 |
| 2022 | $10,946 | $246,700 | $130,400 | $116,300 |
| 2021 | $10,741 | $246,700 | $130,400 | $116,300 |
| 2020 | $10,569 | $246,700 | $130,400 | $116,300 |
| 2019 | $10,265 | $246,700 | $130,400 | $116,300 |
| 2018 | $9,962 | $246,700 | $130,400 | $116,300 |
| 2017 | $9,833 | $246,700 | $130,400 | $116,300 |
| 2016 | $9,597 | $246,700 | $130,400 | $116,300 |
| 2015 | $9,417 | $246,700 | $130,400 | $116,300 |
| 2014 | $9,232 | $246,700 | $130,400 | $116,300 |
Source: Public Records
Map
Nearby Homes
- 27 Oak Crest Rd
- 15 Aspen Rd
- 54 Paris Cir Unit 1954
- 22 Meyer Ct Unit 1622
- 15 Korwel Cir
- 302 Metzger Dr
- 29 Sichel Ct
- 29 Herbert Terrace
- 1490 Pleasant Valley Way
- 59 Glenview Dr
- 8 Fordham Rd
- 11 Hamilton Rd
- 280 E Cedar St
- 382 Saint Cloud Ave
- 8 Timber Hill Dr
- 24 Oak Ave
- 31 Sheridan Ave
- 33 Maple Ave
- 10 Rale Terrace
- 54 Maple Ave
- 15 Oak Crest Rd
- 19 Oak Crest Rd
- 13 Oak Crest Rd
- 4 Hickory Rd
- 6 Hickory Rd
- 21 Oak Crest Rd
- 20 Oak Crest Rd
- 8 Hickory Rd
- 22 Oak Crest Rd
- 11 Oak Crest Rd
- 18 Oak Crest Rd
- 23 Oak Crest Rd
- 10 Hickory Rd
- 16 Oak Crest Rd
- 26 Oak Crest Rd
- 14 Oak Crest Rd
- 12 Hickory Rd
- 12 Oak Crest Rd
- 25 Oak Crest Rd
- 7 Oak Crest Rd