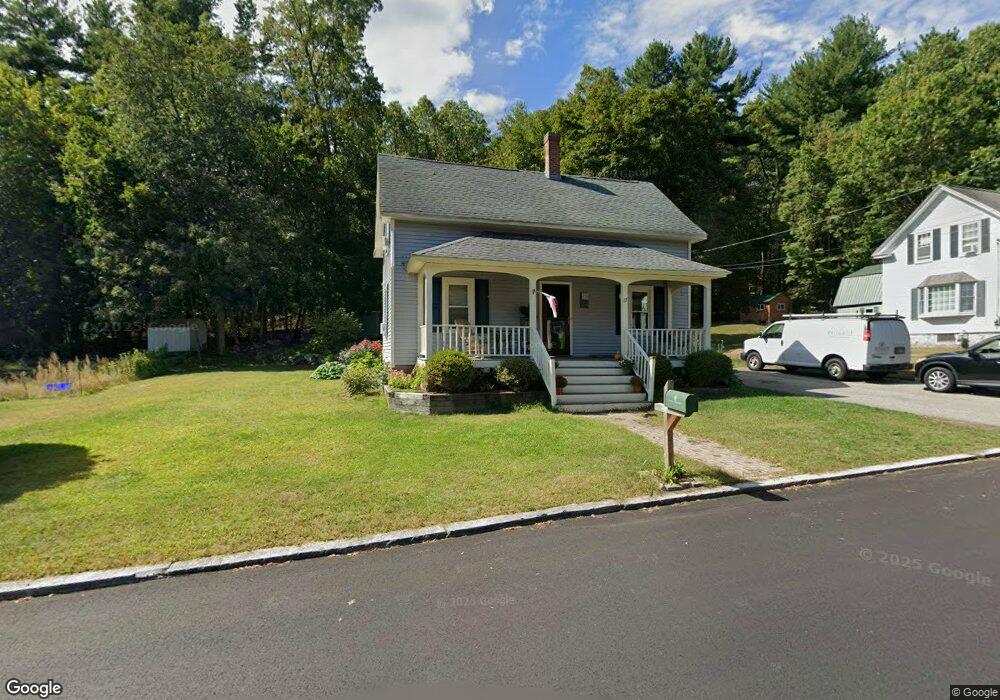
17 Orchard St Westford, MA 01886
Estimated Value: $525,324 - $671,000
2
Beds
2
Baths
1,414
Sq Ft
$410/Sq Ft
Est. Value
About This Home
This home is located at 17 Orchard St, Westford, MA 01886 and is currently estimated at $579,331, approximately $409 per square foot. 17 Orchard St is a home located in Middlesex County with nearby schools including Rita E. Miller Elementary School, Day Elementary School, and Blanchard Middle School.
Ownership History
Date
Name
Owned For
Owner Type
Purchase Details
Closed on
Dec 21, 2015
Sold by
Stander David W and Stander Pamela J
Bought by
Stander Ft and Stander David W
Current Estimated Value
Purchase Details
Closed on
Apr 24, 1990
Sold by
Stander Eliz Ellen
Bought by
Stander David W
Purchase Details
Closed on
Feb 17, 1989
Sold by
Holmes James J
Bought by
Stander Eliz Ellen
Create a Home Valuation Report for This Property
The Home Valuation Report is an in-depth analysis detailing your home's value as well as a comparison with similar homes in the area
Home Values in the Area
Average Home Value in this Area
Purchase History
| Date | Buyer | Sale Price | Title Company |
|---|---|---|---|
| Stander Ft | -- | -- | |
| Stander David W | $122,750 | -- | |
| Stander Eliz Ellen | $104,000 | -- |
Source: Public Records
Mortgage History
| Date | Status | Borrower | Loan Amount |
|---|---|---|---|
| Previous Owner | Stander Eliz Ellen | $80,000 | |
| Previous Owner | Stander Eliz Ellen | $118,650 |
Source: Public Records
Tax History Compared to Growth
Tax History
| Year | Tax Paid | Tax Assessment Tax Assessment Total Assessment is a certain percentage of the fair market value that is determined by local assessors to be the total taxable value of land and additions on the property. | Land | Improvement |
|---|---|---|---|---|
| 2025 | $6,249 | $463,900 | $284,100 | $179,800 |
| 2024 | $6,084 | $441,800 | $270,600 | $171,200 |
| 2023 | $6,032 | $408,700 | $257,800 | $150,900 |
| 2022 | $5,600 | $347,400 | $196,500 | $150,900 |
| 2021 | $5,353 | $321,700 | $196,500 | $125,200 |
| 2020 | $3,555 | $321,700 | $196,500 | $125,200 |
| 2019 | $20,570 | $288,400 | $188,300 | $100,100 |
| 2018 | $4,534 | $280,200 | $180,100 | $100,100 |
| 2017 | $3,003 | $269,300 | $180,100 | $89,200 |
| 2016 | $4,835 | $296,600 | $180,100 | $116,500 |
| 2015 | $4,628 | $285,000 | $180,100 | $104,900 |
| 2014 | $4,037 | $243,200 | $173,000 | $70,200 |
Source: Public Records
Map
Nearby Homes
- 9 Elm St
- 16 Abbot St
- 12 Brookfield Dr Unit A
- 34 West St
- 66 N Main St Unit 66
- 64 N Main St Unit 64
- 66 Patten Rd
- 8 Sandy Beach Rd
- 3 Hillside Ave
- 222 Forge Village Rd
- Lot 6 Noble Path
- Lot 7 Noble Path
- 19-21 Broadway St
- 12 Patten Rd
- 11 River St
- 26 Bayberry Rd
- 6 Little Hollow Ln
- 7 Mill Park Place
- 7 Dempsey Way
- 28 Graniteville Rd