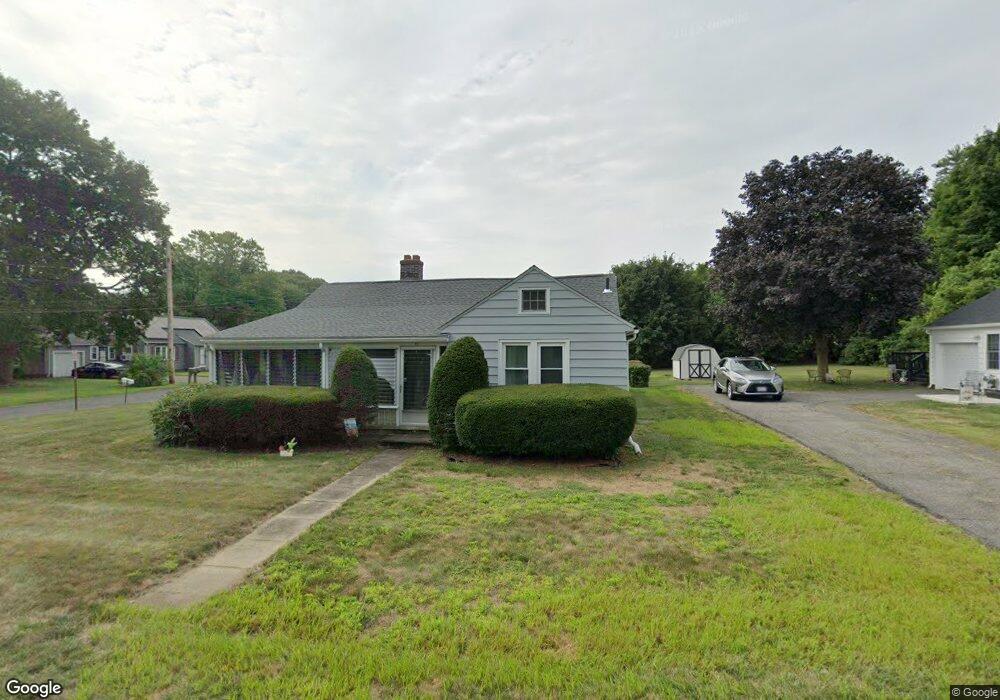
17 Parkview St Ludlow, MA 01056
Estimated Value: $285,954 - $302,000
2
Beds
1
Bath
1,098
Sq Ft
$270/Sq Ft
Est. Value
About This Home
This home is located at 17 Parkview St, Ludlow, MA 01056 and is currently estimated at $296,239, approximately $269 per square foot. 17 Parkview St is a home located in Hampden County with nearby schools including East Street Elementary School, Chapin Street Elementary School, and Paul R. Baird Middle School.
Ownership History
Date
Name
Owned For
Owner Type
Purchase Details
Closed on
Nov 22, 2022
Sold by
Skowyra Paul M and Queiros Deborah A
Bought by
Stpierre Nicholas and Garcia Emma E
Current Estimated Value
Home Financials for this Owner
Home Financials are based on the most recent Mortgage that was taken out on this home.
Original Mortgage
$192,000
Outstanding Balance
$182,372
Interest Rate
4.38%
Mortgage Type
Purchase Money Mortgage
Estimated Equity
$113,867
Create a Home Valuation Report for This Property
The Home Valuation Report is an in-depth analysis detailing your home's value as well as a comparison with similar homes in the area
Home Values in the Area
Average Home Value in this Area
Purchase History
| Date | Buyer | Sale Price | Title Company |
|---|---|---|---|
| Stpierre Nicholas | $230,000 | None Available | |
| Stpierre Nicholas | $230,000 | None Available |
Source: Public Records
Mortgage History
| Date | Status | Borrower | Loan Amount |
|---|---|---|---|
| Open | Stpierre Nicholas | $192,000 | |
| Closed | Stpierre Nicholas | $192,000 |
Source: Public Records
Tax History
| Year | Tax Paid | Tax Assessment Tax Assessment Total Assessment is a certain percentage of the fair market value that is determined by local assessors to be the total taxable value of land and additions on the property. | Land | Improvement |
|---|---|---|---|---|
| 2025 | $4,155 | $239,500 | $74,900 | $164,600 |
| 2024 | $4,007 | $221,500 | $74,800 | $146,700 |
| 2023 | $3,613 | $185,200 | $62,200 | $123,000 |
| 2022 | $3,436 | $171,900 | $62,200 | $109,700 |
| 2021 | $3,447 | $163,500 | $62,200 | $101,300 |
| 2020 | $3,301 | $160,100 | $61,200 | $98,900 |
| 2019 | $3,068 | $154,800 | $60,700 | $94,100 |
| 2018 | $2,874 | $151,200 | $60,700 | $90,500 |
| 2017 | $2,831 | $152,800 | $61,800 | $91,000 |
| 2016 | $2,661 | $146,800 | $60,500 | $86,300 |
| 2015 | $2,497 | $144,400 | $59,900 | $84,500 |
Source: Public Records
Map
Nearby Homes
- 70 Sroka Ln
- 84 Chapin Greene Dr
- 259 Prospect St
- 517 Ideal Ln Unit 401
- 162 Highland Ave
- 31 Greenwich St
- 676 Chapin St
- 102 Swan Ave
- 59 Prospect St
- 374 East St
- 665 Center St Unit 706
- 63 Oak St
- 287 East St
- 98 Fuller St Unit 32
- 25 Dale St
- 37 Franklin St
- 37 Waters Edge Unit 37
- 350 West Ave Unit 5
- 0 Fuller St Unit 73409741
- '0' Rood St
Your Personal Tour Guide
Ask me questions while you tour the home.