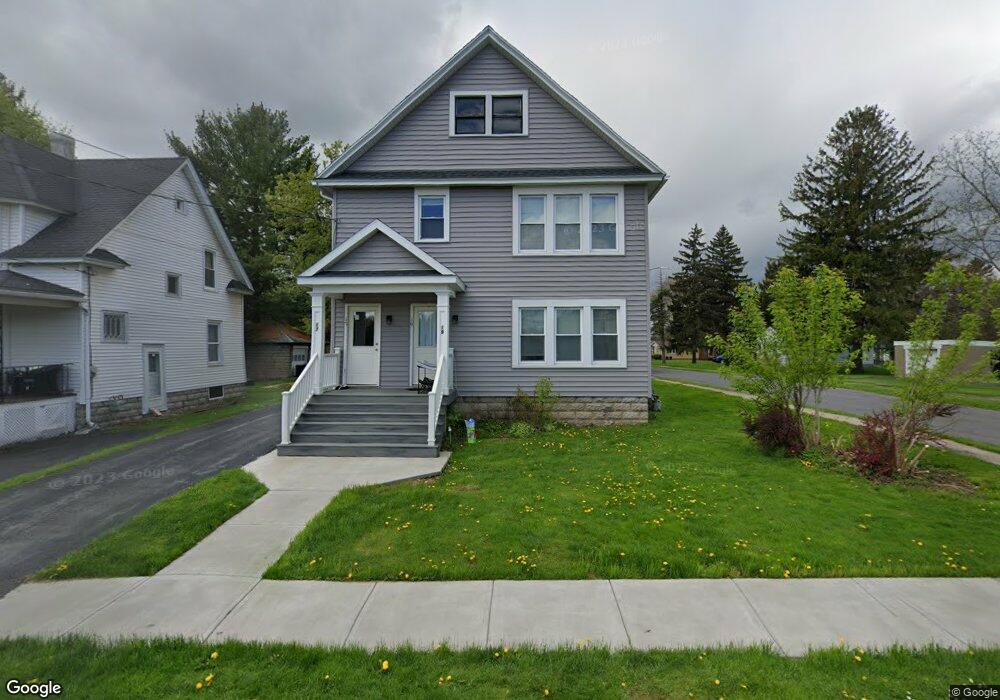
17 Peacock St Unit 19 Auburn, NY 13021
Estimated Value: $122,622 - $142,000
4
Beds
2
Baths
2,184
Sq Ft
$60/Sq Ft
Est. Value
About This Home
This home is located at 17 Peacock St Unit 19, Auburn, NY 13021 and is currently estimated at $131,156, approximately $60 per square foot. 17 Peacock St Unit 19 is a home located in Cayuga County with nearby schools including Auburn Junior High School, Auburn High School, and St Joseph School.
Ownership History
Date
Name
Owned For
Owner Type
Purchase Details
Closed on
Aug 15, 2025
Sold by
Moran Eugene Anthony
Bought by
Gregory Donald M
Current Estimated Value
Purchase Details
Closed on
Feb 25, 2015
Sold by
Vitale Joseph G
Bought by
Moran Eugene Anthony
Purchase Details
Closed on
Aug 11, 2003
Sold by
Vitale Joseph G
Bought by
Vitale Joseph G
Purchase Details
Closed on
Jun 9, 2003
Sold by
Bouley Susan D
Bought by
Vitale Joseph G
Purchase Details
Closed on
Jan 13, 1999
Purchase Details
Closed on
Oct 1, 1997
Sold by
Johnson Jean
Bought by
Saville Joseph E and Saville Susan D
Purchase Details
Closed on
Sep 12, 1995
Create a Home Valuation Report for This Property
The Home Valuation Report is an in-depth analysis detailing your home's value as well as a comparison with similar homes in the area
Home Values in the Area
Average Home Value in this Area
Purchase History
| Date | Buyer | Sale Price | Title Company |
|---|---|---|---|
| Gregory Donald M | $125,000 | None Listed On Document | |
| Moran Eugene Anthony | $65,000 | Joseph Pettigrass | |
| Moran Eugene Anthony | $65,000 | None Available | |
| Vitale Joseph G | -- | Samuel P Giacona | |
| Vitale Joseph G | $74,500 | Samuel P Giacona | |
| -- | -- | -- | |
| Saville Joseph E | $68,500 | -- | |
| -- | -- | -- |
Source: Public Records
Tax History
| Year | Tax Paid | Tax Assessment Tax Assessment Total Assessment is a certain percentage of the fair market value that is determined by local assessors to be the total taxable value of land and additions on the property. | Land | Improvement |
|---|---|---|---|---|
| 2025 | $2,893 | $124,100 | $16,600 | $107,500 |
| 2024 | $2,893 | $124,100 | $16,600 | $107,500 |
| 2023 | $2,890 | $124,100 | $16,600 | $107,500 |
| 2022 | $2,826 | $124,100 | $16,600 | $107,500 |
| 2021 | $2,356 | $86,000 | $15,000 | $71,000 |
| 2020 | $2,319 | $85,999 | $15,000 | $70,999 |
| 2019 | $723 | $85,000 | $15,000 | $70,000 |
| 2018 | $2,297 | $85,000 | $15,000 | $70,000 |
| 2017 | $2,408 | $88,000 | $15,600 | $72,400 |
| 2016 | $2,930 | $88,000 | $15,600 | $72,400 |
| 2015 | $866 | $88,700 | $15,600 | $73,100 |
| 2014 | $866 | $88,700 | $15,600 | $73,100 |
Source: Public Records
Map
Nearby Homes
- 19 Peacock St Unit 19 PEACOCK ST
- 15 Peacock St
- 13 Peacock St
- 11 Wilson Ave
- 18 Peacock St
- 20 Peacock St
- 11 Peacock St
- 13 Boston Ave
- 25 Peacock St
- 22 Peacock St
- 9 Peacock St
- 5 Wilson Ave
- 8 Wilson Ave
- 5 Boston Ave
- 24 Peacock St Unit 26
- 27 Peacock St
- 7 Peacock St
- 28 Peacock St
- 29 Peacock St
- 10 Cameron St
Your Personal Tour Guide
Ask me questions while you tour the home.