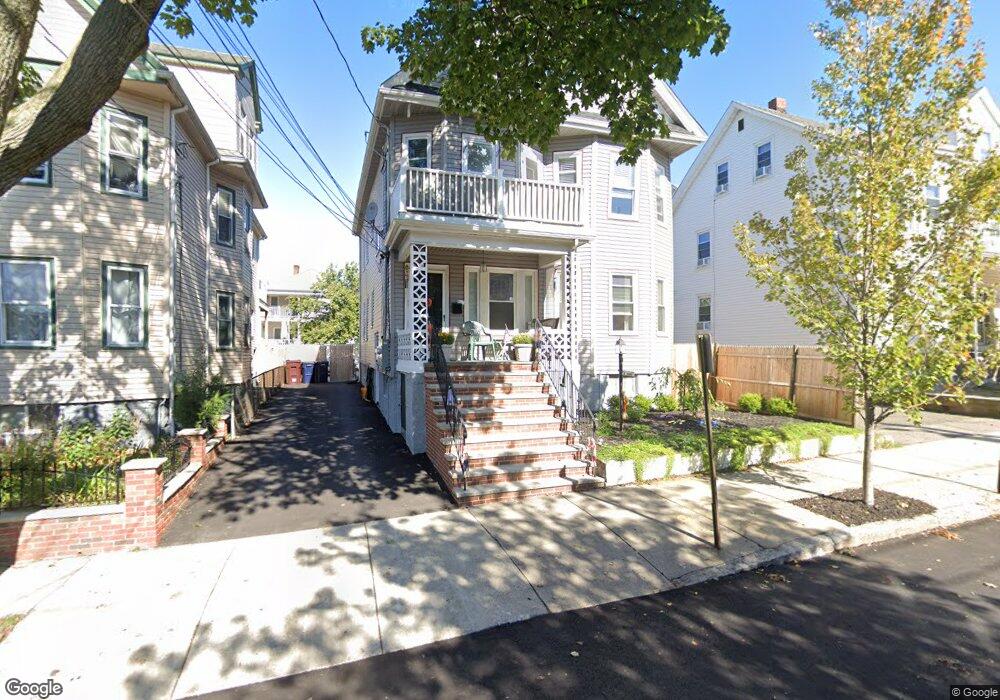
17 Pearl St Everett, MA 02149
West Everett NeighborhoodEstimated Value: $811,321 - $953,000
6
Beds
2
Baths
2,735
Sq Ft
$325/Sq Ft
Est. Value
About This Home
This home is located at 17 Pearl St, Everett, MA 02149 and is currently estimated at $887,830, approximately $324 per square foot. 17 Pearl St is a home located in Middlesex County with nearby schools including Everett High School, Pioneer Charter School of Science, and St Anthony School.
Ownership History
Date
Name
Owned For
Owner Type
Purchase Details
Closed on
Feb 18, 2025
Sold by
Cardile Marjorie W
Bought by
John Cardile Lt and Cardile
Current Estimated Value
Purchase Details
Closed on
Nov 25, 2024
Sold by
Cardile John
Bought by
John Cardile Lt and Cardile
Purchase Details
Closed on
May 9, 2023
Sold by
Cardile Kristina
Bought by
Cardile Marjorie W and Cardile John
Purchase Details
Closed on
Nov 21, 2018
Sold by
Cardile Marjorie W
Bought by
Rutledge Francesca
Purchase Details
Closed on
Jun 28, 2006
Sold by
Cardile Marjorie W
Bought by
Cardile John and Cardile Kristina
Home Financials for this Owner
Home Financials are based on the most recent Mortgage that was taken out on this home.
Original Mortgage
$256,000
Interest Rate
6.58%
Mortgage Type
Purchase Money Mortgage
Create a Home Valuation Report for This Property
The Home Valuation Report is an in-depth analysis detailing your home's value as well as a comparison with similar homes in the area
Home Values in the Area
Average Home Value in this Area
Purchase History
| Date | Buyer | Sale Price | Title Company |
|---|---|---|---|
| John Cardile Lt | -- | None Available | |
| John Cardile Lt | -- | None Available | |
| John Cardile Lt | -- | None Available | |
| John Cardile Lt | -- | None Available | |
| Cardile Marjorie W | $50,000 | None Available | |
| Cardile Marjorie W | $50,000 | None Available | |
| Rutledge Francesca | -- | -- | |
| Rutledge Francesca | -- | -- | |
| Cardile John | -- | -- | |
| Cardile John | -- | -- | |
| Cardile John | -- | -- |
Source: Public Records
Mortgage History
| Date | Status | Borrower | Loan Amount |
|---|---|---|---|
| Previous Owner | Cardile John | $256,000 | |
| Previous Owner | Cardile John | $175,000 |
Source: Public Records
Tax History
| Year | Tax Paid | Tax Assessment Tax Assessment Total Assessment is a certain percentage of the fair market value that is determined by local assessors to be the total taxable value of land and additions on the property. | Land | Improvement |
|---|---|---|---|---|
| 2025 | $8,921 | $783,200 | $243,400 | $539,800 |
| 2024 | $7,950 | $693,700 | $197,600 | $496,100 |
| 2023 | $7,729 | $656,100 | $188,000 | $468,100 |
| 2022 | $6,348 | $612,700 | $181,200 | $431,500 |
| 2021 | $5,878 | $595,500 | $181,200 | $414,300 |
| 2020 | $6,175 | $580,400 | $181,200 | $399,200 |
| 2019 | $6,545 | $528,700 | $172,600 | $356,100 |
| 2018 | $6,387 | $463,500 | $150,400 | $313,100 |
| 2017 | $5,928 | $410,500 | $125,300 | $285,200 |
| 2016 | $5,245 | $363,000 | $115,700 | $247,300 |
| 2015 | $4,967 | $340,000 | $108,700 | $231,300 |
Source: Public Records
Map
Nearby Homes
- 340 Main St
- 139 Bucknam St
- 48 Cleveland Ave
- 120 Wyllis Ave Unit 217
- 120 Wyllis Ave Unit 401
- 80 Main St Unit 9
- 80 Main St Unit 4
- 67 Converse Ave Unit 69
- 39 Parlin St Unit 203
- 82 Medford St Unit 2
- 21 Central Ave Unit 10
- 21 Staples Ave Unit 26
- 15 Staples Ave Unit 45
- 15 Staples Ave Unit 31
- 91-95 Medford St
- 89 Judson St
- 24 Corey St Unit 101
- 44 Walnut St
- 9 Carter St
- 39 Montrose St Unit 2
Your Personal Tour Guide
Ask me questions while you tour the home.